This week, I continue my examination of family-owned businesses (FOBs) and try to understand why they have been such good performers overall, and whether there are any particular issues to watch for or to avoid.
Geographic and Industrial Exposure
The table shows that half of the universe is sourced in Asia ex Japan, while of the other half, one half is in Europe and 30% is in the US and Canada with Latin America, the rest of Europe and the Middle East and Japan being smaller.
CS Family 1000 2023 Geographic Breakdown by Number of Companies
Source: Credit Suisse
Family owned businesses in the west have tended to be stable, well governed, managed for the long term and hence high quality. Certainly, some of the Asian family-owned businesses enjoy similar characteristics. In my experience, one issue with such businesses is that where governance is weaker, the family can favour its own interests at the expense of the minority or external shareholders. This can range from excessive compensation to outright fraud.
Having said that, the performance in Asia has actually been better than the global average – 3.3% pa CAGR vs 3% globally and 3.6% in developed Europe. But obviously if you are not buying a basket but an individual stock, that risk remains very real and increases the importance of due diligence on the accounting issues.
Note: A lot of readers are new and many not be aware that I run an Forensic Accounting Course for institutional investor teams and a cohort-based version for individuals. If you would like to avoid investing in companies whose earnings are being managed, get in touch at info@behind thebalancesheet.com.
STOP PRESS: I am doing a special seminar on accounting red flags in Omaha on Sunday May 5 – spaces are strictly limited. Learn more and get your ticket here. Be quick - they WILL sell out. Premium subs get a discount - coupon code PAIDSUB.
The breakdown by sector is shown in the table:
CS Family 1000 2023 Industry Breakdown by Number of Companies
Source: Credit Suisse
Tech is poorly represented while consumer and industrial companies form almost half the group with real estate being over-indexed as you might expect – I know many substantial private companies in the property sector which have benefited from the long term backdrop of declining rates and grown significantly.
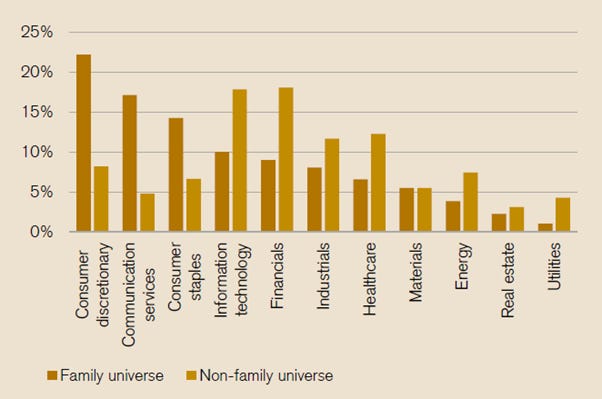
The following chart shows in which sectors family-owned businesses tend to be over-indexed on a market capitalisation basis which gives a rather different picture:
CS Family 1000 vs non-Family-owned Companies by Sector (market-weighted)
Source: Credit Suisse
About one-fifth of family-owned businesses are first generation or founder-led. While around a quarter of the companies in Europe and the Middle East are on the fifth generation of family ownership. The figure is close to 20% in the US and Canada also.
My take is that the risk is lower at these extremes – you can generally trust the founder to continue to grow the business and if it has lasted five generations, the chances are high that it will continue to endure. I tend to be more cautious on generations 2, 3 and 4 as there is no certainty that the child will inherit the parent’s acumen.
CS Family 1000 2023 Generational Breakdown
Source: Credit Suisse
Universe Stability
I was surprised to see the number of changes in the Credit Suisse Family 1000 universe in a relatively short timeframe. The changes in the table in EMEA are significant with 14% falling out of the selection thanks to delisting or other reasons. Overall 9% fell out and 3% were added for a net 5% attrition.
Changes in Family Business Universe 2020-2022
Source: Credit Suisse
Family-Owned Businesses’ Stock Performance
The Credit Suisse report analyses the performance of the group in various ways. Overall the family-owned group has better revenue growth than the control group, but the difference has shrunk significantly from mid single digit 10-20 years ago to c.2% today. That’s still a significant difference however, especially in a universe this large.
And the FOBs tend to have higher margins as can be seen in the chart:
EBITDA Margins: FOBs minus non-FOBs
Source: Credit Suisse
The 15 year average differential in margins has been 1% and today it stands closer to 3% so it may be that revenue growth has been sacrificed in favour of margin.
But the differential is perhaps most striking when returns are considered. The chart shows that FOBs have displayed returns which are c.150bps higher than non-FOBs pretty consistently. That’s a huge difference on a 5-6% base.
CFROI Returns: FOBs vs Non-FOBs
Source: Credit Suisse
CFROI is the Credit Suisse measure of returns as used in their HOLT database which makes significant adjustments to the reported accounting data. It stands for Cash Fow Return on Investment and is a helpful parameter to use for valuation if you are a HOLT customer.
We saw in the studies last week that the average indebtedness of FOBs is significantly lower than peers so the returns have been achieved with lower risk. Dividend payouts have also been higher for family-owned businesses, so you are being paid to be patient.
ESG Criteria
The CS study uses Refinitiv data to score the two universes on ESG and I am wary of placing too much reliance on these scores but it’s worth noting the governance gap in the chart. This is improving but it’s a key risk area and in my view, you have to do a lot more diligence on governance when dealing with this type of stock. There are no free lunches in the stockmarket.
Average ESG scores for FOBs relative to non-FOBs
Source: Credit Suisse/Refinitiv
Performance
It’s worth repeating the chart shown last week, illustrating the degree of outperformance. Family-owned businesses have outperformed the control group by an average of 3% per year.
Relative Stock Performance: FOBs vs non-FOBs
Source: Credit Suisse, Refinitiv
Carmignac has a similar study but its base year is 2004 and it looks at 500 companies. This group has enjoyed stock appreciation CAGR of 10.2% pa vs a 7.9% increase for the control group of non-family businesses.
Do family businesses outperform in the stock market?
Source: Carmignac
Here is the CS performance differential by generation. The lower risk, longer-established stocks may be less risky but they don’t generate as much alpha.
Relative Stock Performance by Generation
Source: Credit Suisse, Refinitiv
The following chart shows the same CS data but this shows the difference in CAGRs by generation:
CAGRs by Generation
Source: Credit Suisse, Refinitiv
Over the period from January 2004 to October 2022, the Carmignac study shows that stocks of companies run by the first generation gained almost twice as much as those run by the fifth generation, a 3x multiplier for 1st generation vs 1.6x for 5th generation.
The conclusion may be 1st generation for performance and 5th generation for durability.
Analysing the Reasons for Better Performance
The studies examined last week suggested that an important reason family-owned businesses tend to do better is their longer term perspective. This is hard to pin down in data but I liked one illustration in the Credit Suisse study, looking at CEO tenure:
60% of non-FBOs have a CEO tenure of under 5 years, vs 40% for FBOs
One quarter of non-FBOs had CEOs in place for 5-10 years vs one fifth at FBOs
40% of FBOs had a tenure of over 10 years vs just 15% in the control group
The universe here is smaller than I would ideally like, as it’s based on the 20 largest companies by market cap, but there may be something in this.
Carmignac looked at family ownership as a factor. From January 2004 to October 2022, the stocks more than 50%-owned by the founding family performed significantly better than stocks with lower family stakes. They contend that this presumably reflects better alignment between the interests of shareholders and management, although I am less sure – if you have hundreds of millions or billions tied up, the actual ownership percentage might be less relevant – you would still want to do the right thing.
Performance by Family Ownership Band
Source: Carmignac
Carmignac also noted a significant difference in the performance of DM vs EM family owned businesses as shown in this chart – this may also reflect governance issues.
Outperformance by Region
Source: Carmignac
Carmignac also looked at the performance of family owned businesses by size band as shown in the table. Large cap performed better but this might be unduly influenced by the inclusion of stocks like LVMH and Hermes.
Performance by Size Band
Source: Carmignac
Comparing Private and Quoted FOBs
Last week I included a spreadsheet of the world’s 750 largest family owned businesses, both private and quoted and I wanted to highlight a few takeaways from this study. There were 340 private companies and 414 quoted companies. The quoted companies were larger with total revenues of $6.3 tn vs $4.0 tn for the unquoted companies.
Quoted vs Unquoted FOBs
Source: Behind the Balance Sheet from Family Capital data
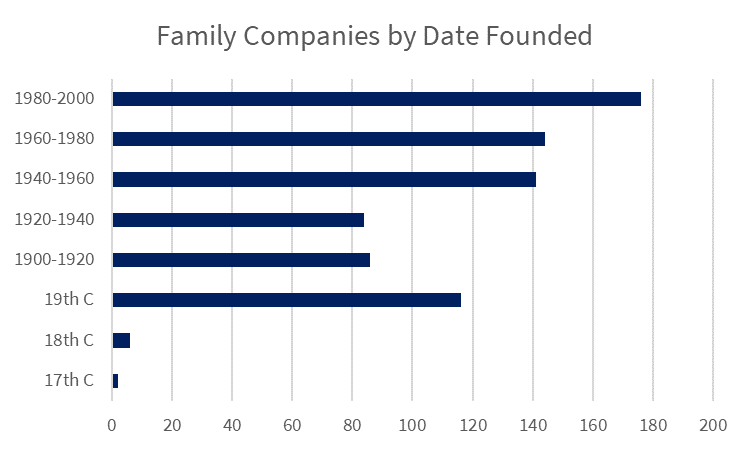
Family owned businesses can be long lived. The bar chart shows this universe by year founded. Obviously the 17th and 18th century stocks are outliers but it’s interesting to look at that list by year founded and see how many companies have lasted over 100 years.
FOBs by Founding Year
Source: BTBS Calculations from Family Capital data
Nearly 30% of this sample have been around for a century which is likely to be longer than for companies as a whole. This doesn’t tell you anything about performance but premium subscribers can read on for one small trick and the link to the more detailed spreadsheet.
Premium subscribers also get exclusive access to a new regular feature, What I Learned This Week, where I share findings from my travels and reading.
Data Notes[see footer]


