Introduction
When the Financial Fair Play rules were first introduced, my friend Tim Keogh persuaded me that we should build an app to analyse football clubs’ performance on and off the field. The app was genius we thought. Indeed, we attracted a bid from a French hedge fund manager and football club owner whom I knew; but we preferred independence and then failed to make a fortune.
A Still from the Footy Finance App
Source: Behind the Balance Sheet
In spite of fun stats like the goal value ratio (the number of goals you saw at home games divided by the cost of a season ticket), or goal efficiency as shown in the still above (how much each club spent to generate a goal), the apps were not as popular as we hoped. And as it involved a huge amount of data compilation (23 teams each year, full accounts data, football data, almost all manually entered), I got bored and we abandoned the project.
But it was tremendous fun working with Tim who is a data visualisation genius (a really useful skill today and one which is under-rated and under-taught: watch out for our new course launching in Q4). We almost sold the concept to Tesco to educate their retail staff about individual shop performance. I am still hopeful that we shall do a similar project, because how many companies can effectively communicate their financial performance to employees on the shop floor?
Football (or soccer, if you prefer) is a goldmine for data analysts as there is a huge amount of information available, even in real time. I met someone recently who is part of a professional betting syndicate. They pay a fortune for real-time feeds of dangerous free kicks and penalties which enable their automated systems to hedge their bets. It has become a sophisticated investment activity.
Investing in Soccer Clubs
Football (soccer) has generally been an unattractive investment. I was reminded of this when recording two recent podcasts. Episode 9, which aired in April, included Jeremy Hosking, who at one point had a major investment in Crystal Palace. I believe he is one of few people who actually made money investing in a football club, since it was subsequently promoted to the Premier League, where the broadcasting rights are incredibly lucrative. Relegation is a financial disaster for clubs.
And in Episode 10, I interviewed Lord (Jim) O’Neill, the man who coined the term Brics, former chairman of Goldman Sachs Asset Management and a lifelong Manchester United supporter. He has been an outspoken critic of the Glazers’ stewardship of the club and it led me to look at the share price chart.
Manchester United Share Price ($)
Source: Behind the Balance Sheet from Sentieo data
I was quite surprised when I looked to see that since IPO the stock had flatlined while the S&P500 had trebled. Subsequently, the price has dropped even more. This is partly a reflection of the strength of the dollar as the club earns in sterling. This long-term trend surprised me, given the increased market recognition of the value of global media content. It made me wonder how other clubs had fared.
There are not many quoted football clubs and some are small and rarely traded. The list includes AFC Ajax, Benfica, Borussia Dortmund, Celtic, Juventus, Lazio, Olympique Lyonnais, Porto, and AS Roma, as well as Manchester United. Rangers and Arsenal have quotes but rarely trade. Rangers actually went bust ten years ago.
It’s odd that a major sport and media industry gets such limited coverage in the financial press, but that has been changing with
The purchase of Newcastle United, led by the Saudi sovereign wealth fund
Scandal at Manchester City, with accusations of illegal payments by the Abu Dhabi owners
The three or four-way skirmish for Chelsea after sanctions forced Abramovich to sell
The more recent fight for AC Milan, currently owned by hedge fund Elliott
I expect more of this trophy asset hunting, but what of the share price performance – can investors profit? The received wisdom always used to be no – in effect, the increased broadcasting rights simply end up in players (and sometimes agents’) pockets. We had thought the financial fair play rules might alter the balance, but that premise proved inaccurate. Here is our index of football clubs’ performance:
Behind the Balance Sheet Football Club Index Performance
Source: Behind the Balance Sheet from Sentieo data
Our index, which is not market cap weighted so that Man Utd doesn’t weigh down the basket, is extremely rough-cut and directional only, shows an appreciation of just under 25% over the last 10 years. When you consider that
The value of global media assets has multiplied many times over that period
The value of stockmarkets has doubled over that period
Well, 25% doesn’t seem that great.
I don’t have good quality data on the financial performance of all these quoted clubs but the average EV:Sales looks to be around 3x and there is only limited profitability in aggregate. My original theory that the bulk of the increases in the broadcast revenues finds its way to the players’ pockets looks likely to be a sensible explanation.
Other Studies
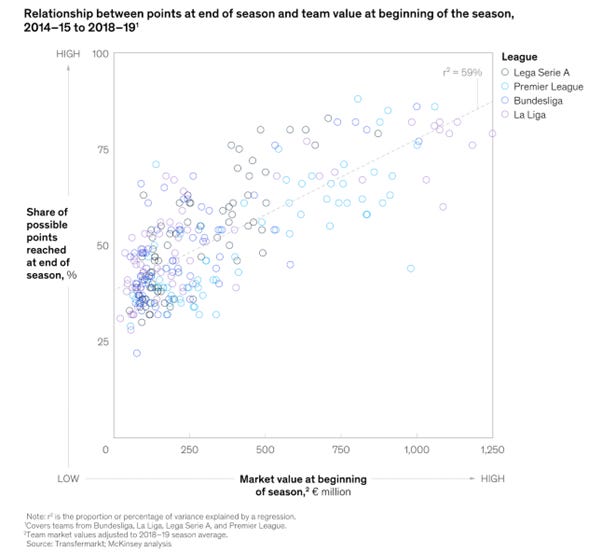
A McKinsey study finds that team market value is correlated to on field performance which is not surprising but I suspect is based on unreliable estimates of player values, is short term in nature (the diagram looks at one season) and rather theoretical.
McKinsey Correlation Analysis
Source:McKinsey
When we studied the Premier League financial performance, I recall that only Manchester United managed to make a profit from buying and selling players – and that was mainly because of the sales of Beckham and Ronaldo. I would be surprised if any Premier League club managed that well today, although Joseph, our in-house football expert, reckons some European clubs have done well at this aspect of the game, notably Ajax and Benfica.
Joseph argues that Ajax and Benfica have excellent youth scouting and training systems plus the benefits of scale in their home countries. This means they either get the best talented 10-year olds or just buy the best youngsters from smaller teams in the country after one good season. I am not sure that this is a profit stream which would attract a high multiple but it certainly improves the quality of the investment.
In our study of the English Premier League, we found that the 37 clubs studied spent £5.5bn on players and made a loss on the players they sold of £1.1bn. The numbers today would of course be much larger.
I was amused to see that a recent paper on the use of crypto currencies by football clubs suggests that crypto tokens don’t offer any benefit over football equities. The authors suggest that first-day trading pops are huge but that the tokens underperform crypto benchmarks, and that the valuations of tokens were unaffected by performance on the pitch.
Other Sports
Although oligarchs and sovereigns like these trophy assets, and although they should be geared to the increased values of the related media assets, investing in football teams doesn’t seem to work, unless you take part in a turnaround (like Jeremy Hosking with Crystal Palace). A better way to get involved is through a central body, like the system at Formula 1. There the teams don’t make any money, but it helps Ferrari to sell cars and presumably Mercedes hope for some reflected glory. Again, it tends to be a plaything for billionaires such as Lawrence Stroll or for enthusiasts like the late Sir Frank Williams who managed to run a team on a relative shoestring compared with the big boys today.
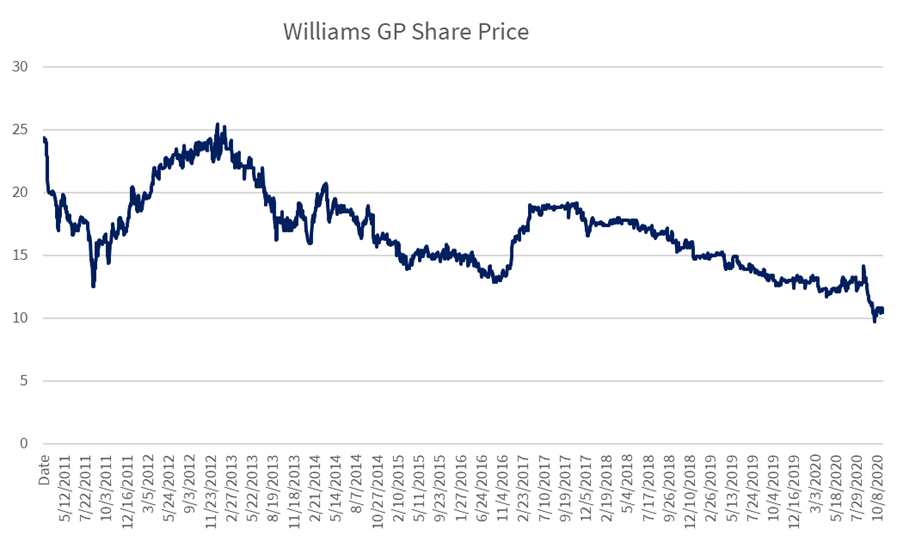
Williams GP Share Price
Source: Behind the Balance Sheet from Sentieo data
Williams entered liquidation in 2020, so that was obviously not a great investment, and the chart shows that holders had limited opportunity for gain in its near-10 year life. But sport, especially global media plays, has intrinsic appeal and I plan to take a closer look at Formula 1 as an investment. Ideas for other plays would be welcome.
Manchester United
Just to square the circle on Man U, I downloaded a few key tables from their 20-F (the equivalent of a 10-K for international filers) looking back 10-odd years to review some of the key metrics. One of the issues many retail investors have when looking at a new company is they try to apply the same standardised metrics.
This approach has certain advantages – you can cross refer the metrics across companies, you are familiar with them and you will find them easy to calculate. But I like to use the analogy of a toolbox – a mechanic will have a wide selection of tools in his toolbox, so that when he has to attack that unusual bolt or screw, he has the right tool. He generally won’t use a pair of pliers to loosen a bolt. Investing is similar – you need to have a wide selection of tools and techniques to apply to different companies and industry sectors.
The distinguishing characteristic of a sports team is that the players are capitalised on the balance sheet and amortised. If you want to understand MANU stock, this is where you need to focus. The first chart shows the employee cost to sales; revenues have recently been distorted by Covid, notably the lack of home match revenue; but even in fiscal 2019, employee costs rose to more than 50% of turnover, with a corresponding adverse impact on the margin.
Manchester United Employee Cost Trend £000s
Source: Behind the Balance Sheet from Sentieo data
The second chart looks at the cash spent on players and the proceeds from player sales. It’s clear that the annual spend has been increasing, but the proceeds from sales are well short – there is a shortfall of more than £100m a year, or 20% of revenues. Of course, one of the largest costs is amortisation, so we should look at the 30%+ EBITDA margins rather than the now single figure EBIT margins, and it’s possible that this is sustainable. But the cash released from player sales relative to revenue is lower than the average in the league when we analysed this data, and it leaves limited cash for other uses, like rewarding shareholders.
Manchester United Player Purchases and Sales £000s
Source: Behind the Balance Sheet from Sentieo data
Paying subscribers can read on to see the analysis of the crucial player finances and some of the fun data we used to produce in our Footy Finance app.


