


The Enduring Edge: Why Corporate Longevity Matters
Exploring the advantages of businesses that are built to last

I have intended to write about corporate longevity and its impact on portfolio performance for some time. I recently asked DeepSeek for some help and it offered me 5 academic articles (including one on ESG which was not part of the prompt), but I couldn’t find any of them in the real world, so I assume it was hallucinating. Until then, (Monday 27 January, the day Nvidia lost $600bn in market cap), I had been enjoying my first few days of DeepSeek.
I wanted to write about this, as for the last 10-15 years, you have made the most money owning companies that haven’t been around for long; and I wondered if that might be about to change.
I like the idea of investing in companies that have been around for 100 years, as the chances are they will be around for the next 100 years. This embedded quality has a cost, of course. You tend to pay up in the multiple and the corollary is that they are unlikely to be fast growing.
I haven’t found much academic evidence on the relationship of company age and performance (still looking), but set out below a few thoughts on the topic. Intuitively, the conclusion has to be that enduring companies are safer and higher quality. And the studies I have found tend to bear that out.
Podcast
First, I am delighted to announce that Alpha-Sense has agreed to continue to sponsor my Behind the Balance Sheet podcast. If you are new to this, I recommend listening to the latest episode with Tom Slater of Baillie Gifford. You might think that the emergence of DeepSeek and Nvidia losing $600bn in a day was unforeseeable. But Tom pointed out that:
1) He had sold down his position in Nvidia in the Scottish Mortgage Investment Trust.
2) He felt that many people had missed the point on China, being obsessed with the issues in the property sector and its economic effects. They were missing the pace of technological change which is accelerating and he specifically mentioned chips.
Of course, he didn't mention DeepSeek as we recorded 2 weeks before meltdown day, but my conversation with Tom is well worth listening to, for a slightly different perspective from one of the top growth investors.

About My Sponsor
If you are unfamiliar with AlphaSense, it’s a market intelligence platform with the number one library of expert call transcripts. I pay for the Sentieo-based research service and (full disclosure) Alpha-Sense have given me access to their expert call transcript library. In my recent introductory training, I was amazed to learn that following their acquisition of Tegus, they have 150,000+ proprietary expert transcripts, growing by 6,000 per month. It’s an astonishing depth and covers 24,000+ public and private companies.
I have only begun to use this aspect of the system, but am looking forward to delivering extra insights here on public companies. Apparently, AlphaSense is used by 75% of the world’s top hedge funds and 85% of the S&P 100. With my existing subscription, I like the ability to search intelligently in call transcripts and company filings and am looking forward to the expanded functionality.
You can take a free trial and check it out for yourself – it will help me if you do so via the link in the graphic below.

ICYMI
A few of you missed the January 31 deadline for the New Year discount offer on our popular Analyst Academy course. If you would like to enrol, I have extended the offer until Friday, February 14. Free subscribers can use the code FREE25 here. Premium subs get an even better deal at the end of this article
Corporate Longevity in the UK
In 1948, it became a requirement for U.K. companies to produce consolidated accounts. An academic study (Meeks & Whittington 2019) took the population of companies quoted on the London Stock Exchange in 1948, and studied how many survived for “three score years and ten”. The study focuses on industrial and services companies and excludes finance, mining and shipping.
The chart shows how many of the population survived the following ten years, although the death rate is boosted by takeovers and mergers, or simple delistings.
UK Survival Rate

Source: Meeks and Whittington 2019
Only 19 of the original 1513 companies survived on this measure. Another study found that 47% of the top 100 global industrial companies survived from 1912 to 1995, but their larger size is likely a major factor. Failures here should generally have been rewarding for stockholders, as the most common reason for a company to disappear was a takeover:
Reasons for Company “Death”

Source: Meeks and Whittington 2019
The academics looked at the contribution of size and growth to survival rates. Hardly a surprise that companies which started big or grew were more likely to survive. Only 1 of the 19 survivors began in the six smallest deciles; and 15 of the survivors were in the two largest deciles at the start– here are the survivors by initial size band:
Survival by Size Band

Source: Meeks and Whittington 2019
Most of these companies remained in the same industry sector, and there was a broad cross section – only 3 changed classification (including Unilever’s transition from chemicals to food).
Starting and Ending Industries

Source: Meeks and Whittington 2019
US Studies
The Bessembinder study of the best-performing stocks in the US divided stocks into <20 year lives and >20 year lives. Leaving aside the stocks which only were around for one year, 10,217 stocks had return histories of 1-5 years.
Although delistings often occur through takeovers (which generally deliver positive returns), these stocks displayed poor performance, with a mean annualised return of -19.8% and a median of -20.6%. Some 63% of these stocks delivered negative compound returns.
There were 12, 395 stocks in the group with return histories of >5-20 years. Again, the majority of stocks performed poorly, as 52% had negative compound returns, and the median compound return was -1.3% pa or -11.5% cumulatively. But as there were some high fliers here, the mean cumulative return was 194.33%, which seems a decent result.
Bessembinder’s primary conclusion was that the distribution of returns is incredibly concentrated with a few big winners delivering the bulk of market returns, a theme I shall return to in a future article.
I would have expected the number of failures to have fallen in the last 10-15 years, given the increasing number of zombie companies which have been kept afloat by cheap money and lenders’ unwillingness to recognise a loss:
Bankruptcies of US Public Companies (Assets >$355m)

Source: Florida-UCLA-LoPucki Bankruptcy Research Database/Counterpoint Global
The general bankruptcy trend (all companies not just large quoted ones) has been reversing rapidly with rising interest rates:
All US Bankruptcies Trend

Source: Trading Economics
There have been more private equity deals in more recent years so takeovers should have been a more frequent reason for delisting:
US Delistings by Cause

Source: Doidge, Karolyi, and Stulz /Counterpoint Global
A paper by Counterpoint Global suggests that, survival rates are improving, based on Bessembinder data, as shown by the chart which shows the survival rate after 5 and 7 years:
Percentage of Companies that Survive 5 and 7 Years by Decade

Source: Hendrik Bessembinder and Counterpoint Global.
Interestingly, another study suggested that life is short for corporations these days. An analysis of 29,688 firms that listed from 1960 through 2009, divided into 10-year cohorts, reveals that newly listed firms in recent cohorts fail more frequently than did those in older ones, because of a fundamental shift in the American economy.
Likelihood of Surviving First 5 Years of Listing

Source: Govindarajan and Srivastava
A company listed before 1970 had a 92 percent chance of surviving the next five years, compared to just 63 percent for a company listed between 2000 and 2009. Even omitting 2000 and 2008, the result holds.
These conclusions are contradictory and I am inclined to favour Mauboussin’s work which I have always found rigorous, but this perhaps illustrates the difficulty in drawing too firm conclusions on these subjects. Perhaps a reader will be able to explain..
The Govindarajan and Srivastava study also found that, in response to the new economic environment, each new cohort of listed firms invests more in intellectual assets and less in physical assets. In the 1960s, firms spent 113% of total assets on capex in physical assets and in the 2002 that had halved to 57%. In contrast in the 1960s, just 28% of investment was in intangibles and that more than doubled to 59% of total assets by the 2000s.
Intangible vs Tangible Investment Trends

I recognise the trend although I was surprised it was not even more pronounced.
Forecasts of Longevity
The median age of an S&P500 company has fallen dramatically from 85 years in 2000 to 33 years in 2018, per a McKinsey report, which forecast that lives would continue to shorten, as per the chart:
S&P500 Average Tenure

Source: McKinsey
A similar forecast was made by Innosight which has been producing reports on corporate longevity for some time. They forecast that the 30-35 year average tenure of S&P 500 companies in the late 1970s is forecast to shrink to 15-20 years this decade:
Average Company Lifespan on S&P 500 Index (years)

Source: Innosight
None of this is helpful to long term investing and of course, many of the disappearances are through acquisition rather than underperformance – here is their latest 3 year table:
S&P 500 Entrants and Exits

Source: Innosight from S&P Global Data
Innosight highlight the emergence of hybrid industries:
The rise of retail-tainment – traditional retailers like Tifany’s and Macy’s being replaced by Live Nation and Twitter.
The shift to digital health – their report cites 9 deals totalling nearly $29bn in value and the emergence of players like Dexcom which makes glucose monitoring devices.
The emergence of e-mobility: Enphase is a renewable energy company, also more obviously the entrance of Tesla to the index.
Inverting the Theme
I didn’t find any of this revolutionary, so I wondered if I might get a different result if I inverted the theme and looked for long lasting companies. I thought this was more interesting.
Fortune produced a study of the companies which were in the S&P500 in 1955 and were still there in 2017. Here are the sectors:
Enduring Companies’ Sectors
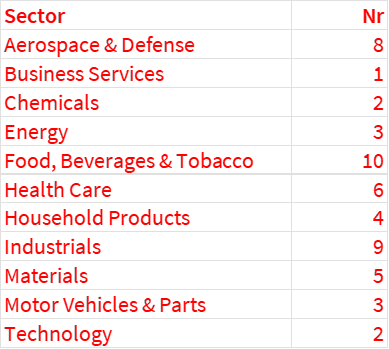
Source: Fortune
Food, drink and tobacco is perhaps an obvious sector and in a study of the brands that appeared in Interbrand’s Top 100 Brands annual survey for the 10 years to 2010 (conducted by The Boston School of Hospitality Administration), food and beverage manufacturing was the largest appearing sector with 1/6 of the appearances. And these were long enduring brands:
Recurring Top 100 Brands by Age

Source: Boston Hospitality Review
Of the other sectors, I was quite surprised by the inclusion of aerospace and defence. Industrials can also have long lives and healthcare is quite an interesting sector, given the degree of innovation in the industry. The list of companies is also worth noting:
Long Lived S&P500 Constituents

Source: Fortune
I then turned to the UK to look at longevity.
Longevity in the UK
I found this table of companies in the UK FTSE 100 founded over 100 years ago.
UK Long Lived Companies

Source: BTBS from Investors Chronicle and Alpha-Sense data
The average age of this group is 180 years. I wouldn’t bet on the oldest, Royal Mail, being around in 18 let alone 180 years, but I like perusing this type of list to try better to understand what makes an enduring business.
Longest Lived Companies’ Sectors
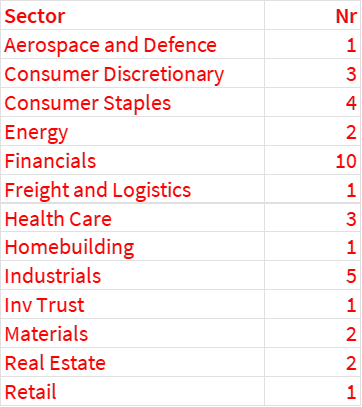
Source: BTBS from Investors Chronicle and Alpha-Sense data
The sectors are more diverse than in the US, suggesting company characteristics may be a more important factor in the smaller UK market. Interestingly, financials is the most popular sector here, yet there was not a single bank which had been in the S&P500 for 60 years. That may reflect the greater diversity of banks in the US, consolidating more now, and the greater historical concentration in the UK.
The consumer staples are a drinks company, a Coca Cola bottler and two supermarkets, while the industrials are pretty diverse.
Longevity Globally
Finally, this graphic shows the longest lasting companies in each country in the world:

That’s going to be difficult to read on mobile, for sure, but here is a summary showing the industries:
Oldest Companies’ Industries

Source: Wyoming Attorney
The drinks sector has been underperforming, mainly because the consumption spike in Covid was extrapolated by markets in revenue growth forecasts and the actual fell well short.
The narrative changed to “Gen Z doesn’t drink” and the growth phase is deemed over by some. Yet, alcohol production is the most frequent sector in the list of oldest companies in the world which is inconsistent with that narrative. I think that’s a potential opportunity.
Longevity in Japan
And no surprise that the oldest company in the world is Japanese because they optimise for longevity. Here is a list of oldest businesses by category:
World’s Oldest Businesses

Source: Nick Velkovski (Twitter @nikolak47)
Conclusion
I think it’s instructive to look at what makes for an enduring company and the best way to do that is to look at which companies have endured, and to understand why. I would love to hear from readers on this.
New York Conference
Value Invest New York will take place on March 26th 2025, with speakers including Joel Greenblatt from Gotham, Rich Pzena from Pzena, Dave Iben from Kopernik, David Samra from Artisan Partners, Jennifer Wallace from Summit Street, C.T. Fitzpatrick from Vulcan, Django Davidson from Hosking – plus Whitney Tilson and many more speakers. If you’re interested in attending, you can see the conference website here and use the code “Behindthebalancesheet25” for a generous discount of $600 until February 17th. I shall hopefully see some of you there.
Premium subscribers can read on for one quick tip: