


Private Equity’s Slow-Motion Crunch
Record dry powder, falling distributions, and 11.9x entry multiples—why the future won’t look like the past.

Something a little different this week. I went to an event organised by The Times with Sir Niall Ferguson and have written up my notes below for premium subscribers- this is a must read if you are interested in geo-politics and there are some profound implications for investors, especially in tech.
And I have one of my occasional write-ups of private equity, with data gleaned from the Bain and McKinsey reports. This industry doesn’t get enough attention from public market investors, given its all-pervasive influence - at least some of your target clients are common and private equity can directly affect your business.
First, an offer from me, then a word from my sponsor. In the next three weeks, I shall be offering some new training to Substack subscribers. I am New York in July to deliver a course to a major institutional client and I now have a day open on Thursday, July 24. After the success of last November’s event, I shall again run my Forensic Analysis Workshop in a midtown location. Spaces are limited so please sign up early:
Below is an advert from my podcast sponsor, AlphaSense. It really helps me if you click on the link and even more if you register.
Get the latest insights on AI, robotics, and autonomous vehicles.
From Tesla to Nvidia to OpenAI, we’ll unpack the key players and trends shaping the next wave of innovation—and what it means for investors.
Where disruptive tech is creating new market opportunities
How industry leaders are positioning themselves to win
The signals investors should track in this fast-moving space
Register now to secure your spot

The private equity industry was in bad shape last year but reports from McKinsey and Bain agree dealmaking rebounded - global PE deal value rose, led by large-cap buyouts and a loosening debt market. But that’s where the harmony ends.
McKinsey describes a sector “emerging from the fog,” noting that for the first time since 2015, LP distributions exceeded capital calls—a relief for capital-starved investors. Despite three years of fundraising declines (–24% in 2024), investor sentiment is bullish: 30% of LPs plan to increase their allocations to PE. There’s also “innovation” in fund structures (e.g. continuation vehicles) and a pivot toward retail capital.
Bain, meanwhile, is more skeptical of a full recovery. Yes, deal values and exits bounced back sharply (both +30% range), but fundraising fell 23%, with a particularly difficult environment for any fund without top-quartile credentials. LPs are cash-constrained: distributions hit just 11% of NAV, the lowest in over a decade. Bain emphasises the weight of aged dry powder, rising asset prices, and tougher competition.
I’m sceptical of McKinsey’s upbeat tone—when the industry has tripled in size, percentage-based metrics matter more than flashy absolute numbers. Distributions relative to paid-in capital are a clear problem, as are high entry multiples (US: 11.9x, Europe: 12.1x EBITDA). IPOs have remained difficult and holding periods are at record highs (average 6.7 years).
I continue to be sceptical that p-e is the answer to allocators’ problems and end this article by repeating the simple supply-demand and valuation arithmetic which mean that past performance is definitely not a guide to private equity’s future.
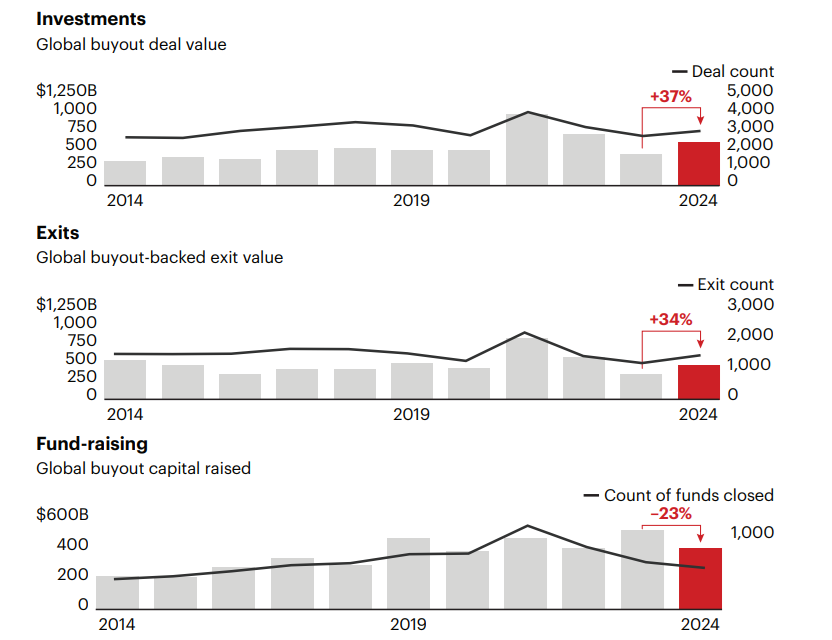
Private Equity in 2024 in One Chart
2024 deal investment value and exit value increased by 37% and 34% respectively. Exit activity picked up, but distributions as a percentage of net asset value fell to 11%, the lowest rate in over a decade. This may be the main reason why fund-raising fell by 23%, given the consequent liquidity situation for limited partners (LPs).
Private Equity in 2024 at a Glance
Source: Bain & Co from Prequin and Dealogic data
The buyout industry has averaged 11% pa growth for two decades and has reached almost $5tn:
Global Buyout AUM

Source: Bain & Co from Prequin and MSCI data
This slowdown in the ratio of distributions to contributions is clearly causing liquidity issues for investors, particularly those who with a 30%+ allocation to private markets. Although the pain is nowhere near the period around the GFC, it’s likely that most allocations to p-e were lower then and investors had much more to worry about. This time round, it’s causing a significant headache to certain allocators, while plain vanilla public strategies have been doing well. This may colour their future attitude to their private equity exposure.
Private equity is sensitive to the issue and 30% of portfolio companies have undergone a liquidity event, with the industry raising a total of $360 billion via minority interests, dividend recapitalisations, secondaries, and net asset value (NAV) loans. We have written about NAV loans before – adding gearing as rates are rising and economic uncertainty is increasing looks a risky strategy.
2024 Activity
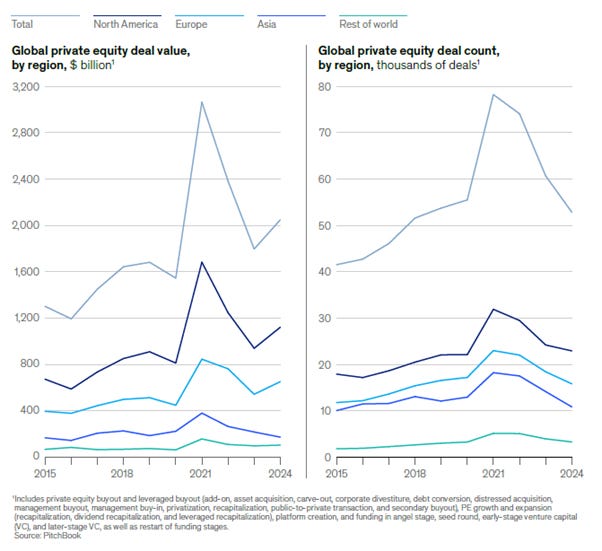
Global private markets had a better 2024 with a 14% rise in deal value to $2tn, across buyout, growth equity and VC.
Deal Value Increased in 2024
Source: Pitchbook, McKinsey & Co Analysis
Deals over $500m increased to 44% (38%) of deal value, more in line with historical averages. Technology, consumer, and financial-services sectors drove the recovery in large private equity deals.
Within that total, global buyout deal volume and value rebounded in 2024, following two years of sharp declines from the 2021 sugar rush peak:
Global Buyout Deals Trends
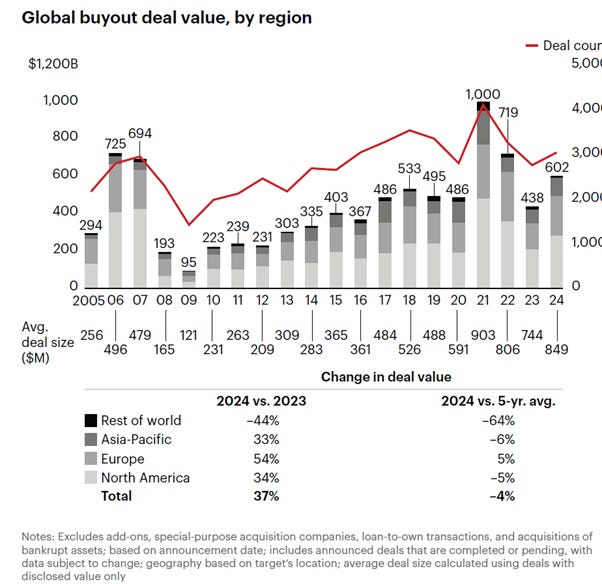
Source: Dealogic, Bain analysis
Deal value rose from $438bn to $602bn, with North America up 34%, Europe up 54% and Asia up 11%. Public to private was almost half of all major ($5bn+) deals in N America, surprising given multiples. Tech was 33% of deals by value and 28% by number.
The analysis by size of deal is interesting – deals in the $2.5-5.0bn bracket jumped in number by 89%, closely followed by the $5-10bn range, up 64% - this is where public market investors should be hunting. This sweet spot was highlighted by Jennifer Wallace of Summit Street in our recent podcast.
Dry Powder
With $1.2tn of dry powder—and 24% of it over four years old —private equity is under increasing pressure to deploy capital fast . And debt markets remain open as private credit funds have accumulated significant firepower.
Dry Powder
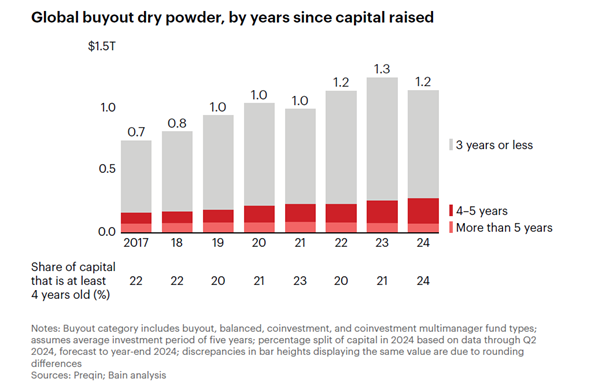
Source: Prequin, Bain analysis
Looking at this from the GP perspective, the amount of capital available to GPs as a multiple of annual deployment fell to 1.89 years in 2024, from 2.02 in the prior year, in line with historical levels:
Inventory
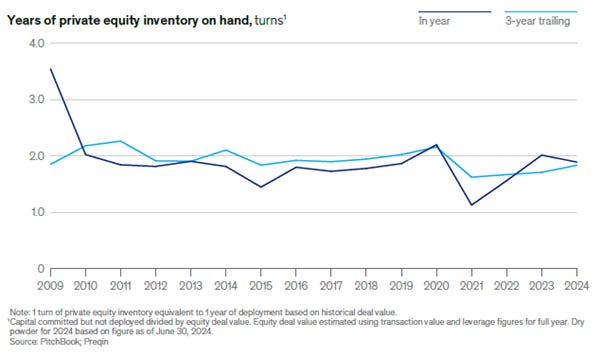
Source: Pitchbook, Prequin, McKinsey & Co Analysis
There were 11,808 companies in US funds at the end of 2024, a 4x since 2018 and with exits running at 1500 pa, it would take 8 years to clear this, per Cherry Bekaert. Hence the increase in holding periods below.
Longer holding periods aren’t automatically punitive for returns, but it means either valuations have to rise or p-e has to improve the businesses. I have explored in previous issues how the value added by p-e has been overstated (more on this below).
US Holding Periods

Source: Pitchbook, Cherry Bekaert
Exits
The value and volume of global exits improved - exit value increased 34% yoy to $468 billion on volume up 22% to 1,470. Activity was stronger in North America and Europe but was broadly flat in Asia, on 2023. Both deal value and volume remain well below their five-year averages and this is a problem given the industry’s increased scale: buyout funds have almost twice the assets as in 2019, but exit value is similar. This is a massive problem for the industry.
Private-Equity Exit by Type, %

Source: Pitchbook, McKinsey & Co Analysis
Sponsor-to-sponsor transactions as a share of total private equity exits reached a ten-year high in 2024 and totalled $181 billion (+141% yoy from a low base), with a 48% jump in deal size, and accounted for 6 of the 10 largest exits globally. The IPO channel remained slow in 2024, representing just 6% of exits by value.
The p-e industry clearly needs more IPOs, but institutional investors have become sceptical of their issues; meanwhile, valuation marks are too high; this will likely be an ongoing problem.
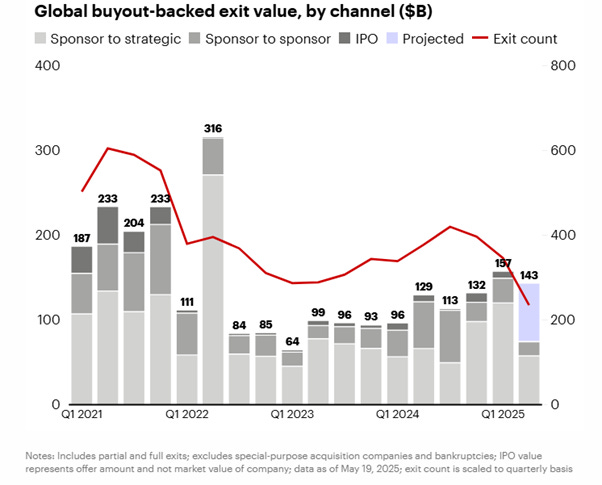
Exit Value Trend

Source: Dealogic, Bain & Co Analysis
Distributions
The big issue for allocators is that distributions have fallen significantly – averaging 44% for the 2014-2016 vintages, it’s down to 20% for the 2019 vintage.
Distributions are Down Relative to AUM

Source: Prequin, MSCI, Bain & Co Analysis
This trend is more pronounced, comparing distributions to capital paid-in:
Distributed to Paid-in Capital has Collapsed

Sources: MSCI, Bain analysis
A Bain survey this year found that 63% of investors wanted P-E firms to exit, even at a discount to the last valuation mark. 17% liked continuation vehicles while 20% were considering selling in the secondary market.
Two trends follow from this lack of distributions:
Partial realisations, mainly financial engineering such as NAV loans.
Growth in secondary funds.
Funds have grown increasingly reliant on generating liquidity through partial realisations as asset holding periods lengthen:
Partial Realisations

Source: SPI by StepStone
Secondaries
Hence the secondaries market has grown, reflecting LPs’ need for liquidity. These funds raised $102bn in 2024, pushing total secondaries AUM to $601 bn. GP-led secondaries are typically continuation vehicles (CVs) which raise cash by moving assets out of a private equity portfolio into a new vehicle; over the last five years, the number of CVs has grown by 4x while total value has increased by almost 3x. Often presented as an innovation, it’s likely that continuation vehicles are sometimes a choice for assets that are otherwise unsaleable at close to marked valuations.
Secondary Funds

Source: Prequin, Bain & Co Analysis
Fund Raising
Global private fund-raising declined for a third straight year, with only two asset classes increasing; infrastructure was flat and direct lending saw a 3% increase:
PE Fundraising by Fund Type

Source: Prequin, Bain & Co Analysis
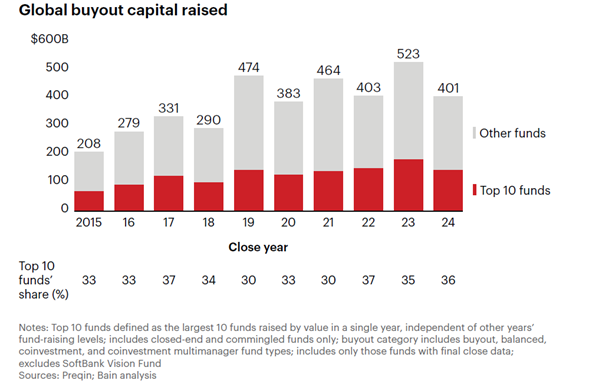
Buyout capital raised fell from a 2023 peak.
Buyout Capital Raising Trends

Source: Prequin, Bain & Co Analysis
The top 25 private equity fundraisers had a lower share (37%) of fundraising in 2024 than in 2023 (40%), and hence big firms saw a sharper decline (top 5 fell from 17% to 15%). Midmarket firms raised more money than in 2023. Almost all the capital went to experienced fund managers.
The top 10 funds typically account for 30% to 40% of all buyout capital raised.
Top 10 Funds’ Share
Source: Prequin, Bain & Co Analysis
Returns
Private equity returns declined to roughly 3.8 percent in 2024.
Private Equity Performance

Source: MSCI, McKinsey & Co Analysis
Surprisingly, McKinsey reckons LPs have increased their target allocation to private equity – from 6.4% in 2015, to 6.3% in 2020 to 8.3% in 2024. Over 60% of LPs are increasing allocations because of better historical risk-adjusted performance and a similar proportion expect increases in the rate of return. I am not making this up, but I sometimes wonder what world they’re living in.……….
This is the historical picture that attracts them (let’s leave aside the failings in the calculation methods):
Returns by Asset Class

Source: MSCI, Bloomberg, McKinsey & Co Analysis
The reported gap vs public market returns is closing in the US, however, probably partly because of the Mag 7:
Trend in Private vs Public Returns – US and Europe

Source: MSCI, Bain & Co Analysis
And here is one reason why the past performance will not continue:
Buyout multiples increased from 11.2x EBITDA last year to 11.9x in the US and to 12.1x in Europe. They were 7x in the aftermath of the GFC.
Multiples have Increased

Source: Bloomberg, SPI by Stepstone, McKinsey & Co Analysis
Here is a second reason: Leverage and market multiple expansion drove 61 percent of investment returns for buyout deals from 2010 to 2022.
Investment Returns Drivers
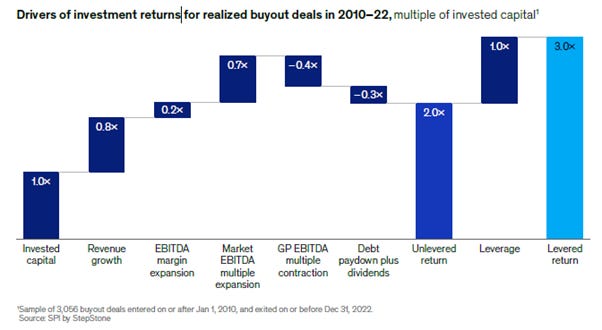
Source: SPI by Stepstone, McKinsey & Co Analysis
2025 Q1 Update
Global buyout dealmaking lost momentum in the second quarter of 2025:
Buyout Deal Value Trend
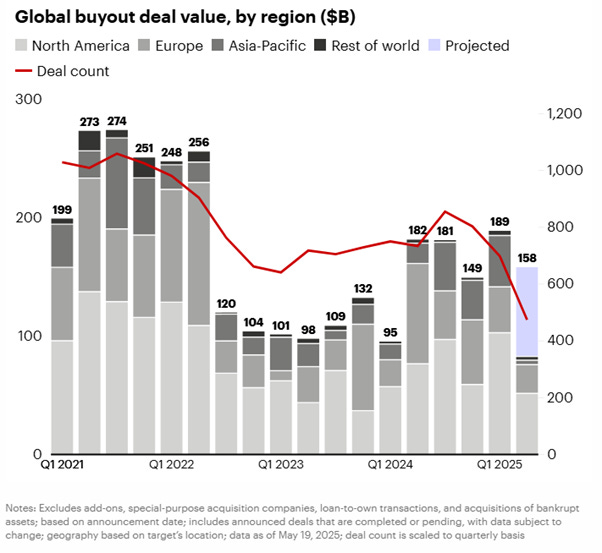
Sources: Dealogic, Bain analysis
Projected exits fell after a promising first quarter:
Exit Values
Sources: Dealogic, Bain analysis
Private market fund raising continues:
Fund Raising
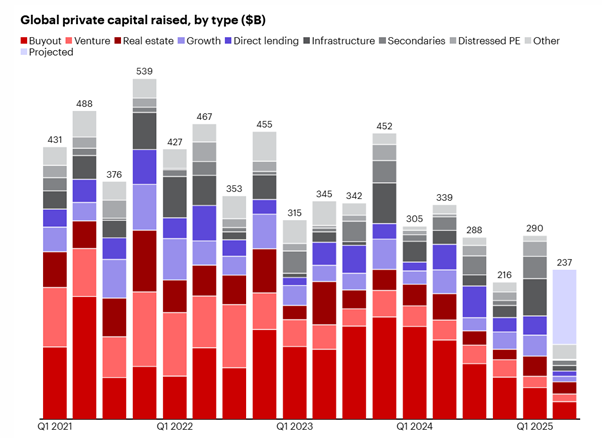
Sources: Prequin, Bain analysis
Even in buyout:
Buyout Fund Raising
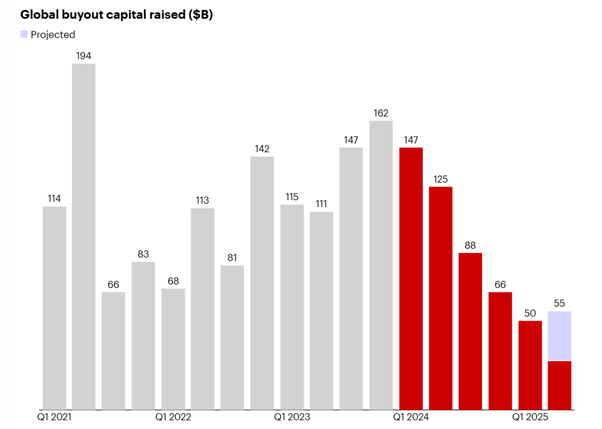
Sources: Prequin, Bain analysis
Although fund sizes are smaller with nothing larger than $5bn in buyout in Q1, 2025. Bain reckons that over 18,000 private capital funds are out collectively seeking $3.3 trillion. That means there’s about $3 of demand out there for every $1 of supply:
Supply Outpaces Demand

Sources: Prequin, Bain analysis
Refinancing in the US and Europe jumped c.80% to around $380 billion in 2024. Maturing loans were $119 billion of that, but US spreads fell more than 1%, lowering financing costs. We should get some more data on the important Q2 in the summer – given the tariff uncertainty, it’s likely to have been quiet, but activity may resume in Q3.
Conclusions
I have written here before several times that the future could look very different from the past. For public markets, that’s likely, but not a given – valuations could continue to rise. But for private equity, without the tailwind of falling rates driving both interest costs lower and valuations higher, it’s almost impossible for past performance to be repeated as
Interest costs are likely higher
Starting valuations are much higher
There is a much larger pool of capital chasing the opportunity
There is a smaller pool of cheap vulnerable targets
The maths doesn’t add up.