


It’s intuitive that as an investor, your best ideas should perform better.
For that reason, some view a portfolio of over 30-40 stocks as being unnecessarily diluted.
After reading Lee Freeman-Shor’s book, The Art of Execution, which revealed that portfolios of top 10 ideas saw a less than 50% success rate, I was keen to explore this subject further. An academic paper referenced in the book has been updated. Best Ideas by Miguel Antón, Randolph B. Cohen, and Christopher Polk is summarised as follows:
“…stocks in which active mutual fund or hedge fund managers display the most conviction towards ex-ante, their “Best ideas,” outperform the market, as well as the other stocks in those managers’ portfolios, by approximately 2.8 to 4.5 percent per year, depending on the benchmark employed. The vast majority of the other stocks managers hold do not exhibit significant outperformance”.
If best ideas have over 3% annual outperformance, that would be a massive gain.
But I was a little dubious, as my experience suggested that even the best stock-pickers with a high win ratio, might be not as brilliant at timing the trades. This is especially true for larger funds which, because of their size, must be earlier into a position.
The academics have selected the best ideas using their own criteria. It’s important to recognise that these aren’t necessarily what the portfolio managers responsible would think were their best ideas:
“…for each stock in a manager’s portfolio, we attempt to estimate from the portfolio choices the manager made what CAPM alpha and information ratio the manager believed that stock would deliver. Then, we label each manager’s holding with the highest estimated information ratio as their “best idea,” and form each period the portfolio of all managers’ best ideas. Finally, we test the performance of this “best ideas” portfolio”.
Whenever I see a reference to the Capital Asset Pricing Model (CAPM), I generally run in the opposite direction. But while I am concerned that the basic premise of this research could be flawed, some observations are worth considering, irrespective of my irreverence towards the CAPM.
The authors’ premise is that managers include extra stocks to dampen volatility:
“..results suggest that while the typical manager has a small number of good investment ideas that provide positive alpha in expectation, the remaining ideas in the typical managed portfolio add little or no alpha. Managers have clear incentives to include zero-alpha positions. Without them, the portfolio would contain only a few names, leading to increased volatility, price impact, illiquidity, and regulatory/litigation risk”.
They also found that the best ideas were larger companies:
“Best ideas tend to be much larger stocks with relatively low book-to-market ratios, relatively high profitability, and relatively high asset growth. As a consequence, though these best ideas are a small fraction of the market in number, in total, they make up a non-trivial portion of US stock market value. The panel highlights that the typical fund’s stake in their best idea is roughly 1.3% of the market of the firm in question and 10.6% of the fund’s AUM”.
They highlight this by illustrating the best ideas by number and value as in the table below:
Number of Ideas and Proportion of Portfolios

Source: Behind the Balance Sheet from the paper Best Ideas Antón, Cohen, and Polk
Their sample consists of US domestic equity funds that reported their holdings in the period from January 1983 to December 2018; they have excluded international funds.
The trend in the number of ideas in the average portfolio has increased significantly over time, almost trebling, as is shown in the chart. Yet most funds underperform – could it be dilution of skill?
Average Number of Positions per Portfolio

Source: Behind the Balance Sheet from the paper Best Ideas Antón, Cohen, and Polk
Given that the best ideas tended to be larger stocks, I was surprised that ideas tended to be fairly unique, less so than in the past, but still quite high as shown in the chart below.
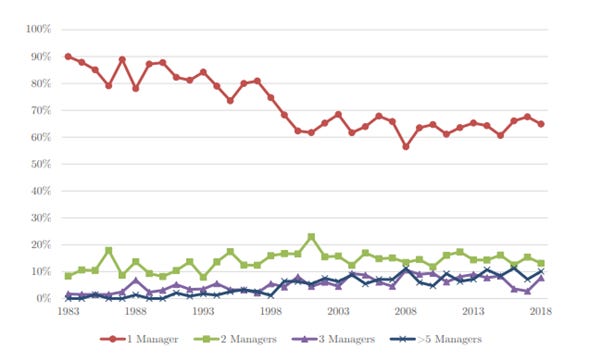
“72% of best ideas are a best idea of only one manager at the relevant time. We note that this statistic has declined over our sample from 90% in 1983 to 65% in 2018. The solid line with squares shows that best ideas are considered as such by two managers around 14% of the time. A stock is the best idea of six or more funds only 5% of the time. Figure 1 shows that these statistics do not vary that much over the sample.”
Fig 1 Overlap of Best Ideas
Source: Best Ideas by Miguel Antón, Randolph B. Cohen, and Christopher Polk
The uniqueness has come down significantly, but the >60% level was much higher than I would have guessed. As was the >90% level in the early eighties, although there were fewer managers then.
The academics also looked at the alpha generated from the best idea down to the tenth best idea.
Unsurprisingly, the tenth best was worse than the best, but note the gap between best and second best idea – it is huge. The paper’s chart labelling generally leaves much to be desired but the difference in performance is clear.
This figure below graphs the monthly six-factor alpha of portfolios based on managers’ best idea, second best idea, and so on, down to their tenth-best idea. The rank of a manager’s ideas are determined by the academics’ information ratio measure
Performance differential for Top 10 Ideas

Source: Best Ideas by Miguel Antón, Randolph B. Cohen, and Christopher Polk
They also look at liquidity, growth and momentum factors. Here is what they say about liquidity:
“The...first variable is stock illiquidity which we measure using the bid-ask spread. We expect stronger outperformance of best ideas among illiquid stocks. Consistent with this view, we find that relatively illiquid best ideas outperform relatively liquid best ideas by 59 basis point per month with a t-statistic of 2.56…”
They believe that growth outperforms significantly, in spite of the length of the sample period (1983-2018):
“…growth stocks are arguably often overpriced, so, if a best idea is a growth stock, then the manager must really believe in it. Consistent with this view, we find that best ideas with relatively higher market-to-book ratios outperform by 86 basis points per month with a t-statistic of 3.94…”
And no surprise, momentum outperforms, although there is no time scale ascribed here:
“…best ideas with relatively higher stock momentum outperform by 76 basis points (t-statistic of 3.21).”
The authors’ overall conclusions are:
“We fail to see managers focusing on their best ideas for a number of reasons. Most of these relate to benefits to the manager of holding a diversified portfolio, [for example] career risk, volatility etc, asset gathering…”
And
“…these results present powerful evidence that the typical mutual fund manager can indeed pick stocks. The poor overall performance of mutual fund managers in the past is not due to a lack of stock-picking ability, but rather to institutional factors that encourage them to overdiversify, i.e. pick stocks beyond their best alpha-generating ideas…”
The conclusions may appear encouraging to some (growth) portfolio managers reading this. I am however dubious about the basis of the research and the conclusions. Much of the statistical content is above my maths competency but the use of CAPM principles to identify the best ideas is likely a weakness.
So do best ideas outperform?
Paying subscribers can read on for my take and for my analysis of the latest blow-up on London’s AIM last week.