
Decoding Private Equity:
Why it’s a key to stockmarkets and how to profit

Introduction
I recently put out a short note, taking a helicopter look at private equity. This week, I drill down deeper because:
1 These were among my most popular articles last year.
2 The size of private markets means that public market investors cannot afford to ignore them and we should understand the principal dynamics.
3 In spite of their size, data on private markets is limited and outdated.
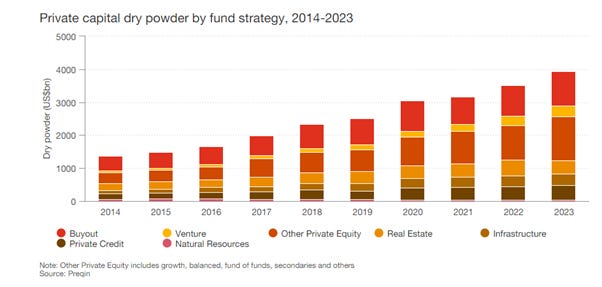
The previous post opened with this chart, showing dry powder and I estimated the equity component of the total to be between $2.5 and $3.0 trillion.
Private Market Dry Powder
Source: pwc
Their General Partners or GPs are highly incentivised to put this money to work. And much of it will presumably be used to take public companies private, especially if stock markets pull back. I didn’t include the next chart which shows that a lot of this dry powder is quite old and will otherwise expire, without attracting any fees:
Global Buyout Dry Powder is Ageing

Source: Investec
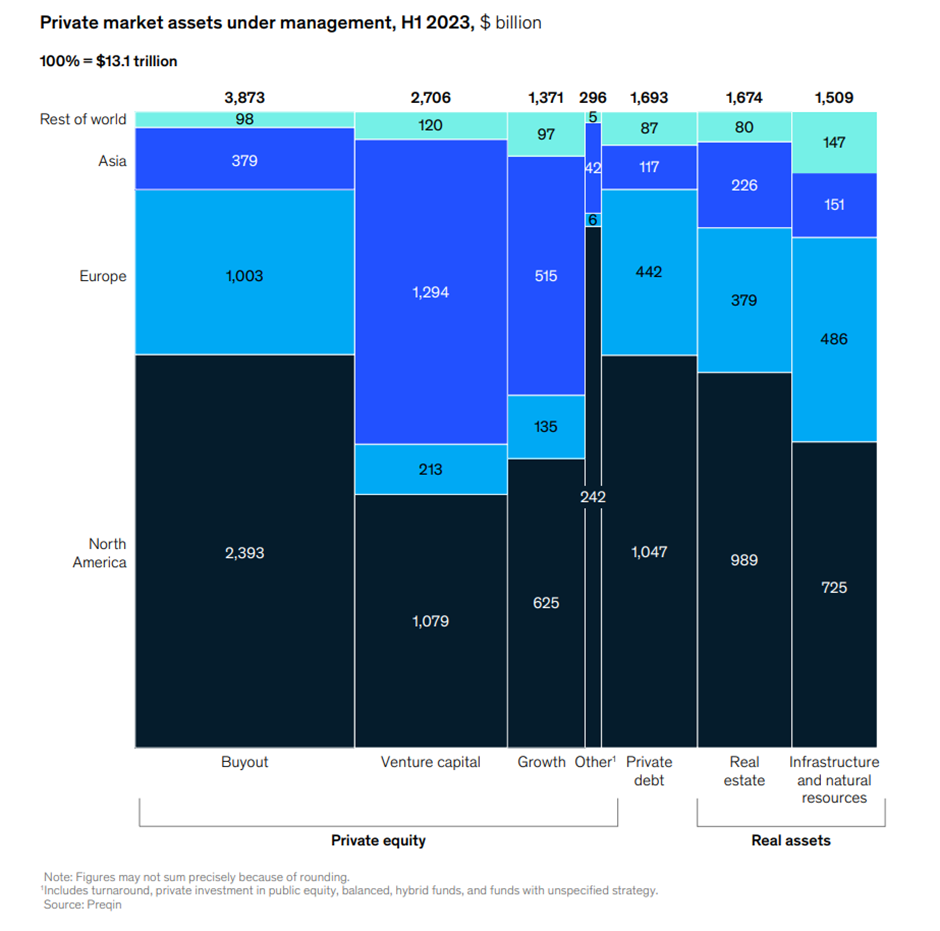
With this backdrop, let’s take a closer look at the world of private equity, starting with what happened last year. These are all huge markets, it’s not just private equity:
Private Markets by Category
Source: McKinsey
The McKinsey report highlighted data from CEM Benchmarking indicating that institutional investors have all time low allocations to equities – 39.8% in 2023 vs 44.2%, 10 years prior – and highest ever allocations to private equity – 10.1% vs 6.4% - and to private markets overall – 27.0% vs 17.3%. Fixed income has fallen from 35% to 30%.
Private Markets in 2023
Background
The correlation between private and public markets is obvious – public markets tanked in 2022 as the zero interest rate oxygen was cut off; and private markets felt the pain in 2023. Deal value fell by 37%; the total value of exits declined 44% and fund-raising was more difficult, with 38% fewer buyout funds closed, although by value the total came close to the highs reached in 2019 and 2021.
From the 2021 peak, the number of deals is down 35% and their value is 60% lower. Unsurprisingly, the value of exits is down 66%, and less than half the number of funds closed.
2023 was not a great year for private equity
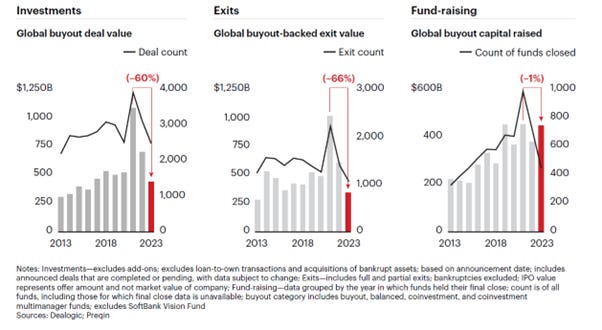
Source: Bain Capital
The volume of deals was naturally also down, and different firms measure this differently, with pwc suggesting that PE buyout activity decreased from a record high of almost 11,000 deals in 2021 to just over 8,000 in 2023, a 27% decline over two years.
They and most commentators are more optimistic about 2024 and beyond, not least because PE is a huge customer. To be fair, there are a number of positive factors:
· Dry powder burning a hole in PE wallets.
· More difficult IPO markets mean that PE funds are motivated sellers, as their holding duration is lengthening and they need to deliver realised returns if allocators are to continue their investment cycle.
· Valuations are improving.
· PEs have increasingly been adopting roll-up strategies in multiple industries which means more acquisitions.
· There are still lots of cheap stocks so there are take-private opportunities, in spite of valuations moving up.
· More stable debt markets, even if rates do not actually fall by much or anything, make it easier to construct buyouts.
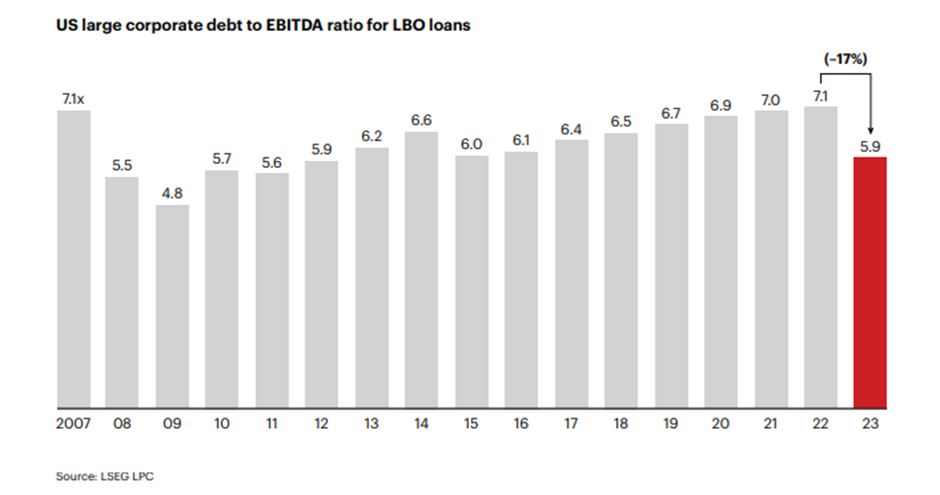
This last is significant because without the debt, the model doesn’t work - yields on leveraged bank loans had risen significantly with a corresponding slump in LBO loan issuance in 2023:
2023 Buyout Debt Trends
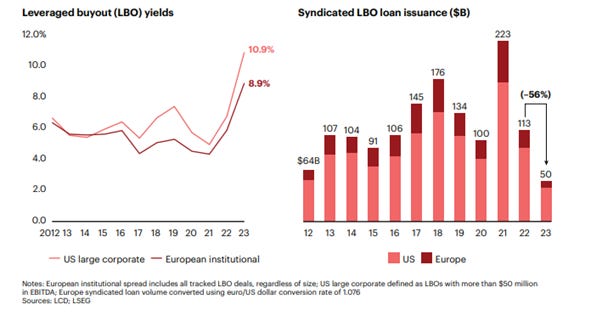
Source: Bain Capital
Performance
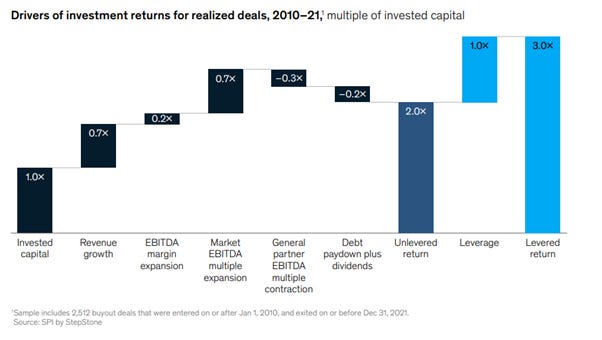
One issue for returns going forward is that multiple expansion has been an essential component of returns in the last decade. McKinsey and Bain analyse the components of returns in slightly different ways.
McKinsey conclude that market multiple expansion plus leverage accounted for 67% of buyout deal returns from 2010 to 2021.
Return Drivers for global buyout deals 2010-2021
Source: McKinsey
Bain does not separate the leverage component – surely an essential to compare returns from private markets with public markets, but split the overall return as being around half and half, growth and multiple expansion.
Return drivers for global buyouts (deal entry years 2013–23)

Source: Bain Capital
Interestingly, Bain further analyses the components by top and bottom quartile. Top quartile deals saw a 50:50 split from multiple expansion and business growth (which split 70% revenue growth and 30% margin expansion). Yet for the private equity industry as a whole, margin expansion delivered a negligible result, as shown in the earlier chart. Bottom quartile deals saw margins decline!
Verdad’s analysis shows that private equity saw slower revenue growth than public markets in 2023 after outperforming in 2022:
Revenue growth: Public vs private

Source: Verdad
They also analysed margins which were much lower in private than public markets:
Margins: Public vs private

Source: Verdad
Valuations
Lately, entry valuations have ticked down which must be a positive for future returns, although it remains to be seen what the 2019-21 vintages will deliver.
Entry Valuations

Source: Bain Capital
In the US, prices unsurprisingly were higher, but have seen a similar tick down:
US Buyout Pricing

Source: Bank of America, S&P LCD Leveraged Buyout Quarterly Review & Pitchbook as of September 2023; figures based on United States leveraged buyouts
One reason is that debt is dearer and harder to procure:
Debt financing could be a constraint
Source: Bain Capital
Why secondaries could prove lucrative
As mentioned previously, PE funds are motivated sellers, because they have been unable to tap IPO markets, but there is a knock-on effect on allocators. The longer duration holding periods mean the asset owners have not been receiving the distributions they likely expected when making the initial investments.
Lengthening Holding Period

Source: Bain Capital
Limited exits mean the value retained by the industry is huge.
And in contrast to a few years ago, when inflows from realisations exceeded new investments, cash flows have been negative for asset owners in the last couple of years:
Global buyout fund capital contributions and distributions
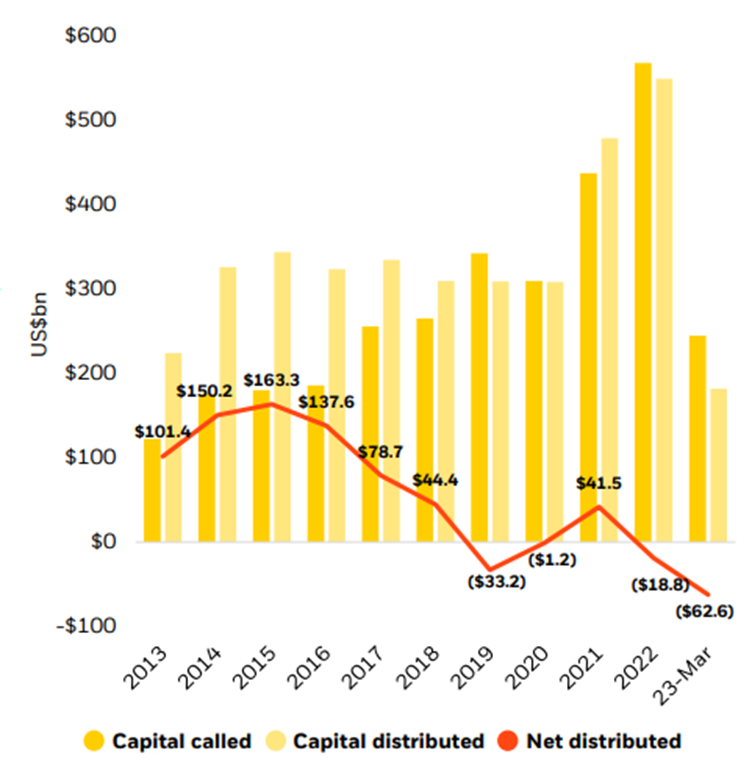
Source: Blackrock, Preqin, data as of March 31, 2023
Blackrock estimates aggregate exit volume in 2022 and 2021 of US$956 billion which is less than 65% of the two-year average. That is one reason why the allocation to P-E has risen but it’s also creating a potential problem as the allocators may not have sufficient capital to fund their commitments to new deals. This could boost secondaries, already a growing market, even in 2023.
Secondaries one of few bright spots in 2023

Source: Bain Capital
And secondaries have price on their side:
Secondaries pricing % of NAV
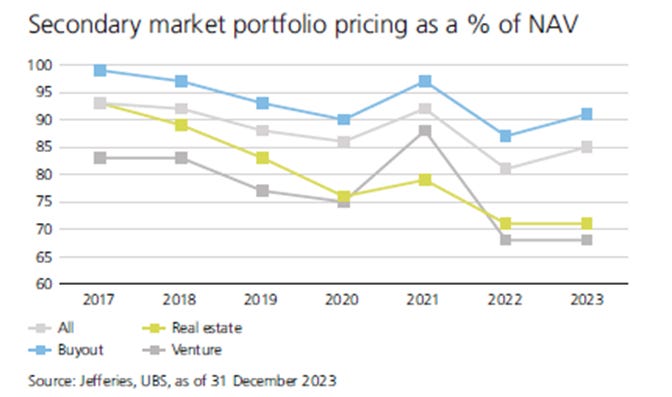
Source: UBS
Investec surveyed 150 GPs and came up with some interesting results. Participants were not bullish: 47% of respondents expected to see returns falling in the next 24 months, with only 24% optimistic that returns would track higher.
Return expectations for next 24 months relative to 2022, for both firm and industry
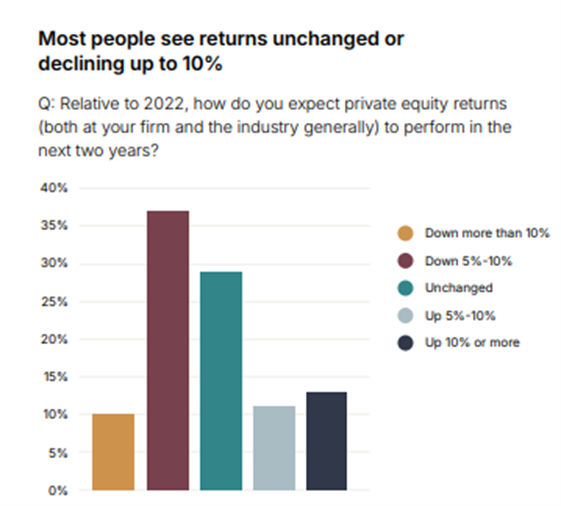
Source: Investec Private Equity Trends 2024
Most participants expected deal valuations in the next 12 months to be unchanged or falling by up to 10%:
How do you think deal valuations will move during the next 12 months?

Source: Investec Private Equity Trends 2024