China Tech’s Dual Personality
A case study in finding out what really drives a company's share price
Back in 2020, an institutional client asked us to review five of the biggest Chinese tech stocks. The client wanted us to look at Alibaba, Tencent, JD.com, Meituan and Baidu, and give an assessment of the quality of their accounting.
One of our key observations was the amount of investment these companies were undertaking.
This wasn’t capital expenditure, as you might expect. Because these companies weren’t investing massively in warehouses, cloud servers and hard assets like their US counterparts. Instead, these five big Chinese tech companies were investing in start-ups.
In five years, this group of companies essentially invested five Vision Funds in the Chinese tech eco-system. True, it wasn’t quite $500bn and it wasn’t 100% invested in China. For example, Tencent made a notable investment in Tesla.
But we thought this level of investment was exceptional. We also thought it was almost certain to result in misallocation of capital. Roll forward two years and I thought it would be interesting to see how those numbers look today.
The Big Five, Two Years Later
The obvious thing to mention is that some (but not all) of this group have drastically underperformed since 2021.
Chinese Tech Stocks’ Performance
Source: Behind the Balance Sheet from Sentieo data
But we’re going to focus on fundamentals rather than share prices.
The group’s net income, which had been uninspiring to say the least, has improved significantly. In the past two years, it was 40% higher than the previous five years. This was mainly driven by lower losses at Meituan and JD.com moving into profit.
Where it gets really interesting is the cash generation of the group and how these cash flows have been deployed. Let’s start with how they’re using the cash.
Chinese Big Tech Sources and Uses of Cash –Seven Years
Source: Behind the Balance Sheet from Sentieo data
The (Huge) Investments Continued
Between them, the five companies have invested a total of $0.75 trillion in acquisitions and non-controlling investments over the past seven years, we estimate. That’s quite a staggering number. Even Masayoshi Son of SoftBank would be impressed.
This would be frightening if the companies hadn’t taken in $0.5 trillion from business disposals. Some of these will certainly be flotations; some will be sales to acquirers; and some may be sales to other VCs and private equity funds.
This means the net investment is a more modest $200bn, funded by operating cash flow.
Capex amounted to less than $100bn over seven years – relatively small change. To put that into context, Amazon alone spent more than this in the past two years. Albeit on a revenue base which is 25- 30% larger than the Chinese sector.
These five big Chinese tech stocks are still using their cash in a very different way to their American peers – the increasing asset intensity of some of the US tech stocks is an important and overlooked subject which I shall return to in a later article. But this wasn’t the most striking thing about the Chinese group’s cash flow.
Where Has The Cash Conversion Gone?
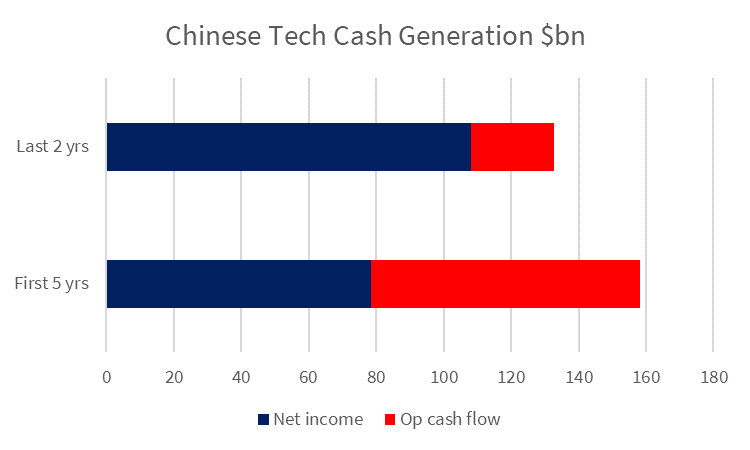
The most interesting data point was the drop in operating cash flow relative to net income.
I explained the improvement in net income was mainly loss reversal, but cash flow conversion for this group of companies was significantly weaker. Operating cash flow is down 16% on the previous five years total, compared with net income that is 40% higher!
Chinese Tech Cash Generation
Source: Behind the Balance Sheet from Sentieo data
Part of the reason may be profits on disposals of investments.
If this is the case, shareholders should probably wish they had done more. For some of these companies, it looks like shareholders’ fortunes rest on the valuation and success of what is in effect a VC fund. Maybe even more than the success of the operational business.
This shows that thinking something is a good business at a fair price might not be enough. You also need to understand the real drivers of a company’s share price.
As we’ve seen here, carrying out a detailed examination of the cash flows can help you understand these drivers. Paying subscribers get a simple tip I use to paint this picture. What’s more, they get a PDF with the 16-point checklist I use to audit tech company accounts.


