


Cathie Wood’s $7 Trillion Prediction
Another baffling Tesla “research” report from ARK

I have deliberately refrained from jumping into the Tesla debate, other than responding to questions in interviews. Of course, the accounting is bizarre and some of the ARK commentary has been juvenile. But I didn’t really fancy being dragged into a never-ending argument.
Today I’m going to break that silence, because ARK’s latest “research” report on Tesla is baffling. I thought for a second it might be a parody but I checked and it wasn’t dated April 1. For the life of me, I cannot understand:
1) How their ETFs still receive inflows when the main fund was down by over 75% from the peak and is almost certainly still over-valued.
2) How “investors” are fooled by this material.
3) How the SEC can allow this type of promotion from a supposedly regulated institution.
ARK’s latest report estimates that Tesla will be worth $2000 per share in 2027. Based on the 2022 average diluted share count, that would amount to $6950bn or just shy of $7tn. Well, I suppose that’s only 2-3 Apples, it’s not impossible. But this is not the blue sky case, or even the bull case – this is the central case.
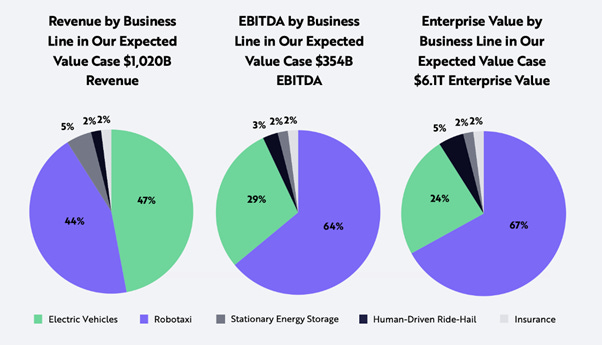
The research doesn’t give any conventional data like market capitalisation, regular valuation multiples, or forecasts. But ARK do forecast revenues and EBITDA and valuation as shown in the chart.
ARK’s Tesla 2027 Business Breakdown
Source: ARK Investment Management LLC, 2023
Given that ARK haven’t published a straightforward set of profit and cash flow forecasts that we can analyse, there is a limit to what we can check. Instead they have carried out thousands of Monte Carlo simulations which might suggest that ARK are just too clever for me. This is clearly a possibility. I don’t want anyone to think that I don’t believe that Cathy Wood is a genius. I honestly think she is a marketing genius, but I am confident that I am better at valuing businesses.
A Monte Carlo simulation enables a user to come up with a range of NPVs for a statistical valuation problem. It uses numerous data points and samples repeatedly to simulate a range of possible outcomes. It’s a clever statistical technique and the spreadsheet provided by ARK with 5000 different answers is 6MB - enough to slow down my PC noticeably in spite of 32GB of memory.
ARK has at least listed some assumptions so we drill down a bit and see if they hold water. Two thirds of ARK’s estimated value is in the robotaxi network so let’s look at the assumptions disclosed (in the Tesla example valuation tab) and see if they sound plausible (spoiler – they don’t).
Their upside case assumes that robotaxis launch in Q4 of this year (!) and the downside case is 2026. ARK published a chart which shows the percent of simulations using first start years of
2023 22%
2024 33%
2025 30%
2026 13%
2027 3%
The weighted average is mid-2024. In the spreadsheet, I calculate Q4 2024 as the average start date. These are not impossible but it would likely be highly restricted to certain geographies. The simulation data therefore suggests a start date of mid-2024, while ARK’s assumptions in the table, taken from their example Tesla valuation tab, show 300k cars in 2025, increasing 3.5x in 2026 and 11.4x in 2027. That’s an implausibly fast rate of growth and clearly 557bn miles is an ambitious target as early as 2027.
The difference in the two start dates – 2024 in the simulation and 2025 in the assumptions – is I think because they show only one or two illustrations. Their tab of 5000 simulations has an average date of end 2024. Perhaps I am missing something obvious, or perhaps the data is not consistent. I intend to email ARK with these questions and some more below and I shall report back.
The spreadsheet supplied gives two sample outputs, one with a price of $1402, the other with a price of $1430. So these examples – which I have used to test the validity of their assumptions - are much more conservative than the central estimate.
I emphasise that I could be missing the point – ARK’s sophisticated techniques may well go over my head. In my experience, however, the best investors are good at explaining their arguments in simple terms. Undue complexity is often an indicator that the creator is trying to obfuscate and does not want you to find out what is going on.
ARK’s Autonomous Taxi Assumptions

Source: ARK Investment Management LLC, 2023
Let’s start with the miles per taxi, which is noted as 16 hours use per day at 20 miles per hour. This would be 116,800 miles per year over 365 days. In the second example sheet, the miles per taxi is 106k. This range of 106k-110k miles is not impossible if you can actually do 16 hours per day at an average of 20mph.
The problem here is that most of these journeys I imagine will be in cities and a large proportion will be in rush hour. Note there are still human drivers on the roads – no pickup in average speed.
As I was penning this on a Tuesday afternoon, I picked five journeys at random and used Google Maps to get estimated drive times. One was at 3am, one was in the late evening, and three were during the day:
Steve’s 5 Random Journeys

Source: Behind the Balance Sheet/Google Maps
The two night-time journeys were achievable at twice the speed and none were completed in rush hour. The overall average speed was just 14mph, a figure that excludes time taken for pickup and drop off, and travelling between jobs. Therefore, I think that a speed of 10mph would be a pretty good result for city centre journeys, which would presumably make up the bulk of robotaxi journeys.
The ARK estimates are twice as optimistic as the numbers I would assume. This matters because they are assuming in the example 557bn miles of revenue; to do that they think they will need 2.4m Teslas. I calculate that they would need twice as many cars and based on their average selling prices and average margins, that would add over $100bn of additional capital.
What about Replacements?
ARK’s forecasts appear to assume that Tesla don’t need to replace the cars. At least I cannot see anything about the life of the cars in their assumptions. By the end of 2027, the first 300k robotaxis will have done 330k miles, and the second 743k robotaxis will have done 220k miles.
A long time ago, a friend used to get 750,000 kilometres (470,000 miles) out of a Mercedes E-Class taxi – but they would get through 3 engines and almost every element of the vehicle had been replaced by the time the car went to the scrap heap. ARK are assuming that the base Tesla will be just $7000 and the robotaxi will sell for $25k and cost $18.5k – I think this is 2027 money but it’s not clear.
Tesla Assumed Sales Prices $

Source: ARK Investment Management LLC, 2023
There is currently significant inflation and upward pressure on commodity prices – presumably that would feed into the cost of a car. A Model 3 starts at $39,990 today. On an average 16.7% margin, the cost would be c.$33k - obviously the margin on the robotaxis would be lower, as extras have a much higher margin, but let’s leave that aside for now. So we are looking at a decline in cost of c.45%, to get from $33k-ish today to $18k in the assumptions. If you inflate the $33k cost today to 2027 at 4% pa, the 2027 cost is $39k and the reduction is 53%.
If anyone can halve the cost of a car in 3 years in an inflationary environment, it’s Elon Musk. But that might be a challenge even for him given the limited time left over after Twitter, SpaceX, AI, Neuralink, Boring Company, and whatever else he will have going in by then. Presumably the car would need new batteries after 100k miles, and would need to be replaced after 200k miles but ARK does not appear to explain any of this. Given the lack of assumptions, I am guessing that this hasn’t been factored in, but I could be wrong.
If we said that ARK’s assumptions on the cost of the car were too aggressive and that the car would last 100k miles and would then be replaced at a net cost of 90% of cost, ie allowing 10% of cost for the value of the old car, the calculations would look rather different. By 2028 the replacement vehicles would have consumed an additional $100bn of capital (at cost, based on selling price less average margin).
Note that I haven’t really tested any of the assumptions yet. I have just had a cursory examination of a few assumptions. Yet on ride-hailing alone, ARK could be $200bn shy on their cash flow requirements by 2027/28 – this would make a real difference to the amount of equity Elon would need, with ARK assuming the issue of “only” $3bn for incentive compensation. The stock has a market cap of $500bn today.
ARK’s example sheets are only two illustrations out of a range although they come up with a valuation which is 30% lower than the central case. The ride hailing assumptions are therefore almost certainly more conservative than the central case. And the calculations look really aggressive to me.
Perhaps I am too stupid and ARK are really good at forecasting. I would be happy to hear their explanation. More likely is that this research is as flawed as the last one I looked at which had the wrong number of shares in issue. I really don’t understand how a regulated provider of investment products is allowed to produce this type of “research”.
My friend Chris Bloomstran, who is an exceptional analyst and a real expert on insurance, partly from his work on Berkshire Hathaway, has a detailed critique of the insurance assumptions which again don’t hold water. Chris has even asked why the CFA has not banned their analyst with the qualification for publishing “analysis” which he argues is not worthy of the description.
And his point that a $7tn valuation is 21% of the S&P500 today is well-made.
Paying subscribers will also receive my spreadsheet analysis.
And before you go, a word from our sponsor…

Expert calls just got easier.
Say goodbye to traditional expert networks with Stream by AlphaSense. Stream enables you to access high-quality expert insights, in less time and at lower cost. With proprietary search technology and a library of more than 26,000 expert call transcripts, Stream provides the tools to help you make smarter decisions faster. Sign up today.