

The Private Credit Playbook
The Private Credit Playbook
Analysing the Bulls’ Outlook in a Booming Market

I have written several articles on private equity but haven’t touched private credit which is becoming an increasingly important asset class. I thought it was important to understand this area better so I am going to devote a couple of newsletters to it. In this first article, I look at the bull case, and have drawn on a report issued by Blackrock which is very bullish on the asset class.
Before we get into it, a word about some upcoming courses which may interest you. I am holding two in-person courses in New York and again running my Zoom-based. fall/autumn BootCamp.
My Forensic Analysis Bootcamp will run for 8/9 weeks in October/November. Learn more here.
I am running my Forensic Accounting Course for one day in New York on November 13. This is a must-attend event for professional investors who want to become faster AND more effective at processing financial statements. Learn more here.
I am holding a half day seminar again in New York on November 12, for private investors who want to become better at analysing financial statements. Learn more here.
Size of the Market
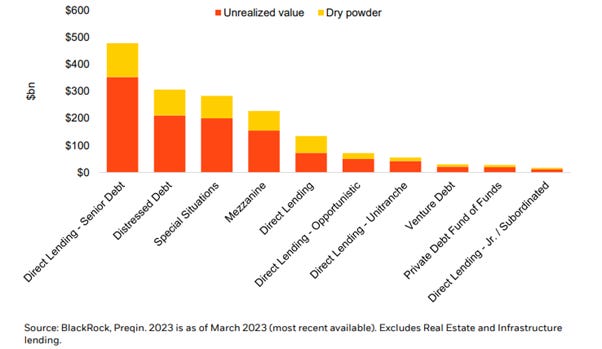
Different commentators have different perspectives on how to define and measure the asset class, which itself is notable – I shall show in a moment how much it has grown. To date, it has largely escaped regulators’ notice, which is one of the unintended consequences of tightening bank regulation - as regulators looked to shore up banks in the wake of the GFC, they left the door open to a totally unregulated form of credit. Blackrock reckons that private debt represents 12% of the $13 trillion alternatives universe:
AUM (unrealised value and dry powder) across alternative asset classes

Private Credit has Grown Significantly
The IMF calculate that there was $2.1 trillion globally in combined assets and undeployed capital commitments in 2023 and that this has “grown exponentially over the past two decades”. Now fast growth and finance are uncomfortable bedfellows and the ending is often tearful.
The Growth of Private Credit Markets
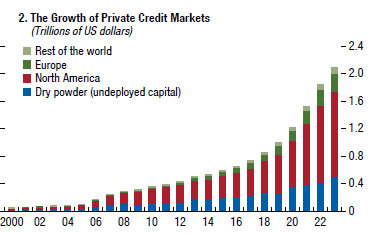
Source: IMF from Bank of America Global Research; Bloomberg Finance L.P.; PitchBook LCD; Preqin; S&P Capital IQ; and IMF staff calculations. Includes private credit funds, business development companies, and middle-market collateralized debt obligations, from 2000 to June 2023.
The drivers of private credit growth include
Borrowers seeking specific funding solutions and certainty of execution.
Greater perceived flexibility, given a long-term borrower/lender relationship.
Investor desire for lower perceived volatility and diversification as well as higher returns.
Shifts in the public markets to focus on larger borrowers, leaving public debt market deal sizes too large for many middle market companies, and
Contraction in bank credit availability.
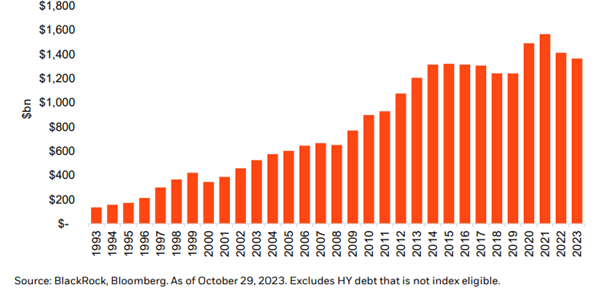
An important part of this is likely this structural shift in public markets, as demand from borrowers has grown. The syndicated USD HY bond and leveraged loan markets have grown significantly since the financial crisis; for example, the Bloomberg USD HY index has $1.36tn of debt outstanding:
Bloomberg USD HY Corporate Index Par Value ($bn)
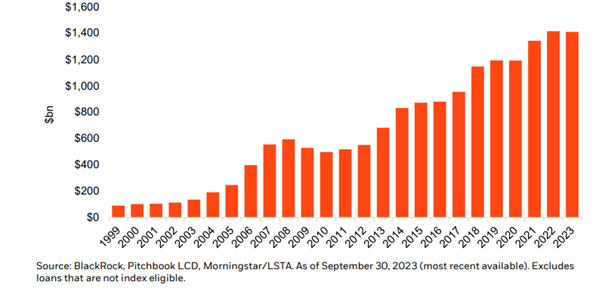
While the Morningstar/LSTA USD Leveraged Loan Index is now $1.4 trillion in size.
Morningstar/LSTA USD Leveraged Loan Index Par Value ($bn)
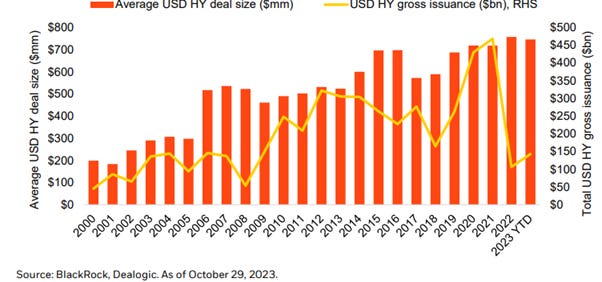
This growth has resulted in more restricted access to public funding markets for small and medium sized firms, as the channel serves larger borrowers. This has resulted in rising average deal sizes for new issues in the High Yield and Leveraged Loan markets.
The average new deal size in the USD high yield corporate bond market has been over $700m over the past three years, after a rising trend over the last decade.
Average USD HY deal size ($mm) and total USD HY gross issuance ($bn)
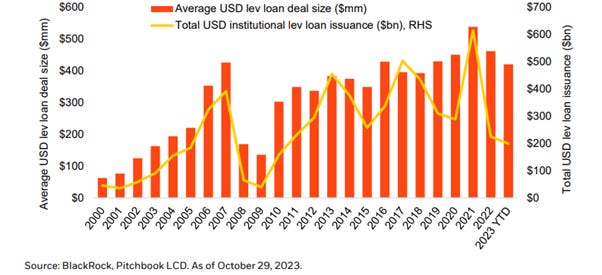
In the USD leveraged loan market, the average new deal size (new institutional money) has been slightly lower, but is still significant at an average of $470m since 2020 (Exhibit 23), and has also been on a rising trend over the last 10 years.
Average USD Leveraged Loan Deal Size ($m) and Total USD Institutional Leveraged Loan Issuance ($bn)
This has squeezed out smaller companies from the public debt markets, as investors look for liquid instruments and it’s one reason why private credit has been popular:
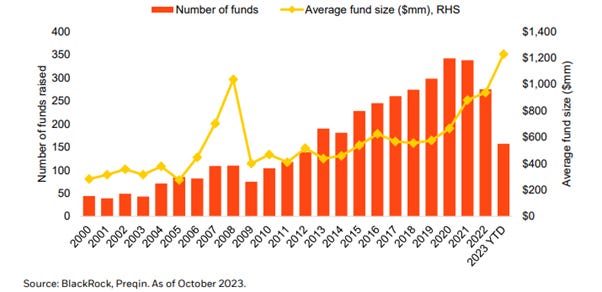
Private debt fundraising
From the borrowers’ perspective, one attraction is faster approvals, as lengthy investor roadshows and rating agency reviews are unnecessary. Private credit firms are competing on their ability to turn around requests – one banker told me that one of the managers will approve a $1bn credit in 24 hours!
Obviously banks like to do due diligence and I question how much you can do in a day. Another feature that many borrowers like is that they don’t need to publish financial data. This might suit the borrower but doesn’t lend transparency to markets.
Blackrock highlight that in Q1-Q3 2023, Pitchbook LCD tracked at least six transactions, totalling nearly $12bn in aggregate, where direct lending deals refinanced broadly syndicated term loans. The largest was $5.3bn. Blackrock foresee that the private debt market will continue to grow in size and increasingly compete directly with the public debt financing markets.
That’s not likely to improve the rigour of lending standards which banks have been tightening:
Net % of Respondents Tightening Standards
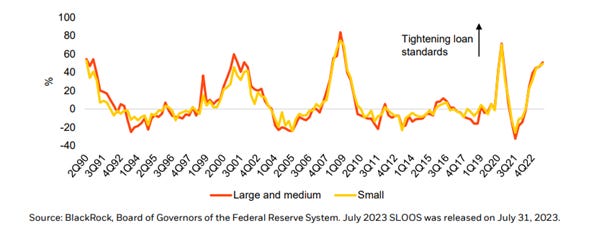
Note: July 2023 Senior Loan Officer Opinion Survey (SLOOS) tightening standards for commercial & industrial (C&I) loans to large/medium and small firms
The pricing of credit has also been increasing:
Increasing Loan Rate Spreads (over Banks’ Costs of Funds)

Higher standards and rising pricing from banks are a boost to the private credit market.
Different Strategies
Private debt encompasses a wide range of strategies. The largest is direct lending, which represents roughly 46% of global AUM (Preqin). North America direct lending represents 26% of global private debt AUM.
Total Private Credit AUM ($bn) by Strategy
Direct lending refers to financing that is directly negotiated between a lender (often an alternative asset manager) and a borrower (usually a small-to-mid-sized company). Such loans are typically floating rate and secured by some portion of the borrower’s assets.
A key difference between direct lending and a leveraged loan issued through the traditional public (syndicated) channel is that direct loans are not sold to multiple investors after they are issued. Instead, they are often held by the lenders until maturity.
The Cliffwater Direct Lending Index (CDLI) is an asset-weighted index of approximately 13,000 directly originated middle market loans with a total of $284bn as of June 30, 2023. Most of these have a maturity of 5-7 years, but are often paid back early, because of a private equity sale of the business, with an effective loan life historically of 3.1 years. That life is increasing as there are fewer exits, to 5.3 years in mid-2023. This is something to watch.
Other categories in the chart are:
Distressed: Purchasing debt of companies at a significant discount that are in bankruptcy, or likely to enter bankruptcy. Debt tends to be senior.
Mezzanine: Subordinated debt, but still senior to equity positions. Can also be a mix of debt and equity financing. Debt has conversion rights to equity (embedded equity option).
Special Situations: Category can span other lending types such as distressed and mezzanine. This provides funding for a specific event, such as a merger or spin-off.
Venture: Loans to start-up / early-stage companies with venture capital backing, to fund growth.
Fund of Funds: A fund that invests in multiple (or several) third-party debt funds.
Opportunistic: A strategy that seeks a diverse set of investments.
Unitranche: Combines senior and subordinated debt into one tranche (instrument), to simplify debt structures.
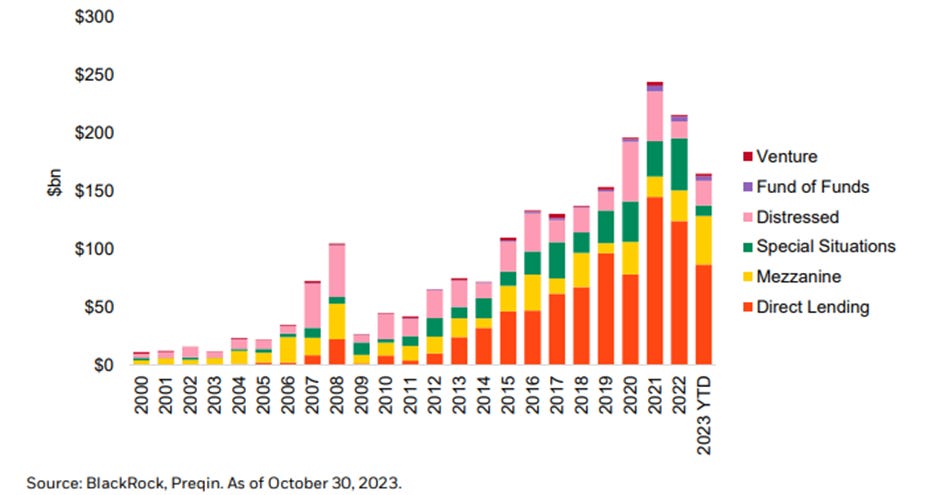
The mix varies significantly from year to year:
Private Debt Raised ($bn) by Strategy
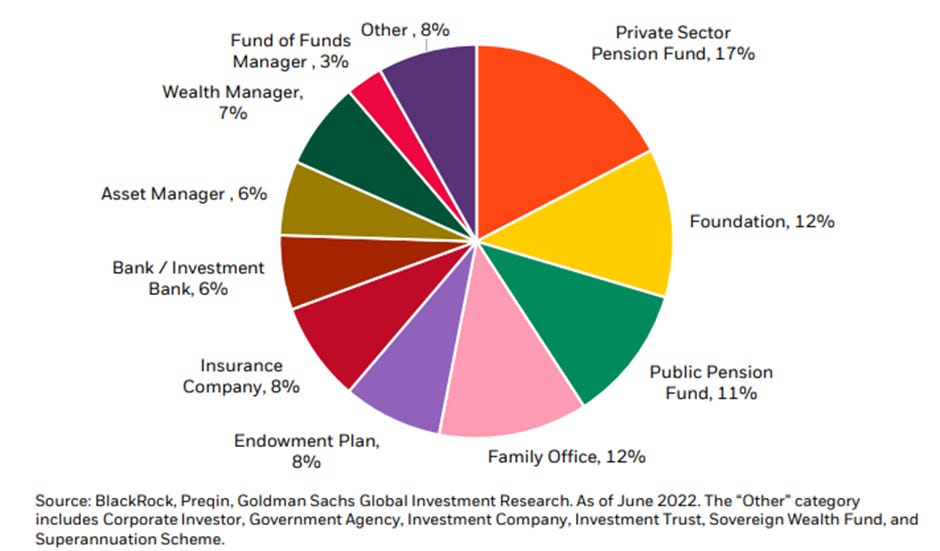
Ownership of private credit is broadly distributed:
Ownership of Private Credit by Investor Type
Performance
Proponents of private credit argue that its performance has been very good. Part comes from a yield advantage over public markets:
Average yields
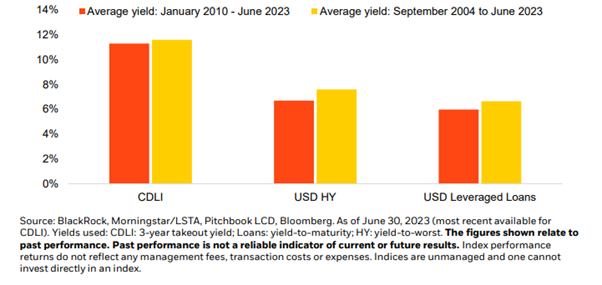
Note: Cliffwater Direct Lending Index (CDLI), Morningstar/LSTA USD Leveraged Loan Index, and the Bloomberg USD HY Corporate Index
My question would be why borrowers are prepared to pay more for a commodity product. Surely the decision speed and lack of disclosure relative to public market sources are not worth this pricing gap? Even more surprisingly, Blackrock contend that the default rates are lower as shown in the following chart:
Historical Loss Rates (%)
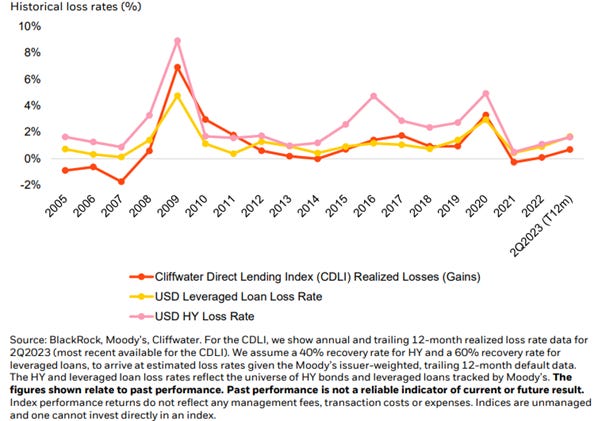
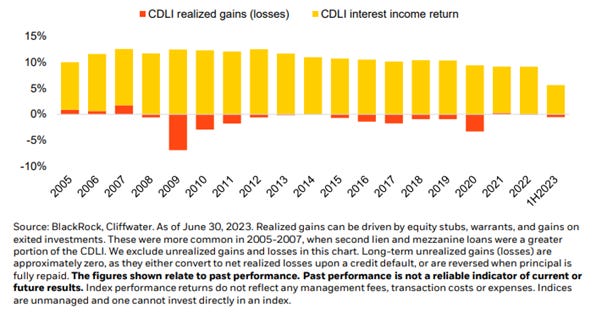
With recent increases in rates, losses would be expected to have increased, but after a period of extremely realised loss rates in 2021 and 2022, the rates have increased but are still surprisingly low – in the first half of 2023, Blackrock report that the CDLI realised losses were just 0.55%, compared to an interest income return of 5.63%.
Perhaps this reflects the willingness of borrowers to borrow more in payment in kind and synthetic payment in kind instruments – these don’t require cash payments, instead the interest is rolled up and repaid as a principal repayment. These allow borrowers to kick the can down the road and gives the private equity sponsor owners time to work out a programme to improve profitability. Anecdotally, we know this is happening but we don’t know the degree.
Realised Losses vs Interest Income
In 2023, default rates started to pick up in public markets, although not to the degree that historically would have been expected, given the tightening in bank lending standards, discussed earlier. It’s highly unlikely that the private credit market would be immune.
Trailing 12 Month Issuer-weighted Default Rates
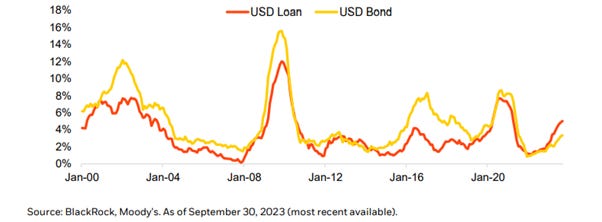
Note: universe of USD HY bonds and USD leveraged loans tracked by Moody's
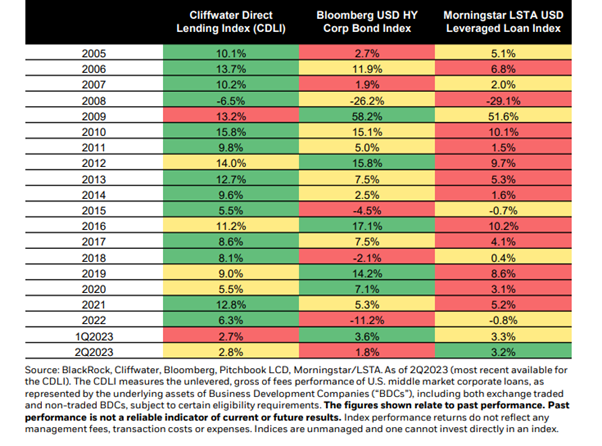
In a period in which interest rates were admittedly benign, private debt outperformed, as shown in the table:
Private Credit vs Public Markets
Why Defaults have been Low
The long-term relationships between borrowers and lenders are likely an important issue in maintaining low levels of default. Private credit and private equity are in the same club and debt extensions, especially in the form of PIK extensions, are a favourite instrument.
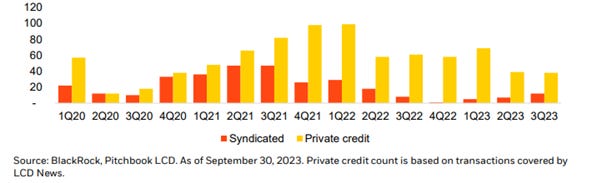
Private equity owned borrowers account for roughly 70% of the value of private credit. And private credit has dominated LBO financing, by deal count:
Count of LBOs Financed in Broadly Syndicated Loan vs. Private Credit Markets
And this may have helped to keep defaults down:
Covenant Default Rates
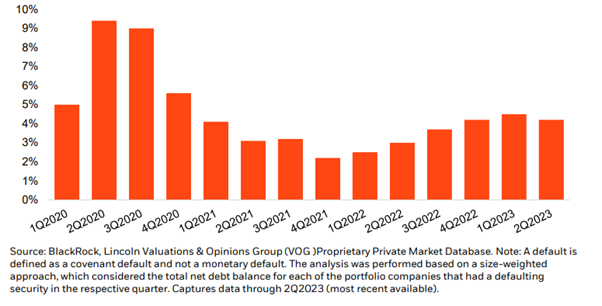
Note: size-weighted, 4,500+ portfolio companies tracked by the Lincoln International Senior Debt Index
The returns to investors are obviously a key driver of the market’s growth. Low default rates clearly help. We shall see how this plays out I a less benign environment, with rates no longer on a long term secular downtrend.
Outlook
Blackrock expects global private credit AUM to reach $3.5 trillion by year-end 2028:
Private Debt Global AUM ($bn unrealized value and dry powder)
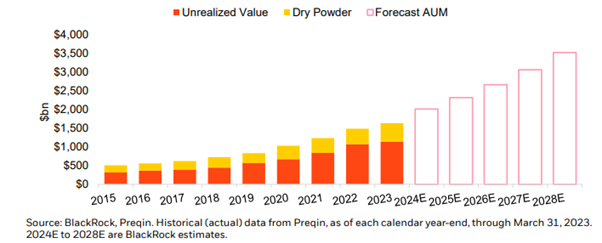
This assumes a c.15% CAGR over the next five years, vs 21% for 2020-2022. That’s a pretty fast growth rate for an extremely large market and as I said at the start, in finance, you want to be careful when you see an acceleration in growth or volume. If defaults increase, asset growth may be slower.
More on all this next week.