

Is Private Equity Smarter or Just More Arrogant?
Is Private Equity Smarter or Just More Arrogant?
How a bullish insider perceives the sector

Some private equity bulls believe that I was too negative in my recent analysis of the sector. So I thought that I would bring you some highlights from Hamilton Lane’s recent positive study of the industry.
Here is the standout comment from their report:
Private equity simply is smarter, better and faster than public equity.
Now, a lot of public equity managers do underperform the index and this is not unique to the current situation where 7 stocks comprise roughly 30% of the index and much of the performance – mandates prevent many managers from holding stocks in that concentration so their universe will by definition underperform. But is private equity really smarter, or better, or faster?
Discover why diversifying your investment portfolio is more crucial than ever with insights from Meb Faber and AlphaSense's Director of Research, Nick Mazing. The discussion, moderated by Jamie Catherwood, will focus on why flexibility and openness to global opportunities are more important than ever in successful investing. Additionally, you'll gain first-hand knowledge of how AI is reshaping market efficiency and investment strategies, drawing parallels with the polarizing impact of social media.
It really helps me if you sign up for these promotions, as my sponsor can see that their investment is delivering. Without sponsorship, the newsletter and podcast are loss-making , so please let’s give my sponsors some love…

Hamilton Lane’s primary rationale is the following table:
Public vs. Private Multiples (Median U.S. Buyout ACQ EV/EBITDA Minus S&P 500 EV/EBITDA)

The blue band from 2007 to 2023 for information technology suggests that private equity players were early to recognise that information and technology offered a better opportunity for growth and returns; and they may have been more willing to pay up for it than managers involved in public markets.
The quote above is laughable in my view but the sentiment behind the table is potentially fair. So let’s dig into the rest of the report and see things from the bulls’ perspective. First, here is how Hamilton Lane describe themselves:
“Hamilton Lane is a leading, global investment manager providing private markets solutions that help our clients accomplish their unique financial goals.” Their home page reveals that they have $900bn AUM (but their results release indicates $66bn of fee-earning AUM which is probably a better indication), they have been around for 32 years and have 1800 clients.
The stock has done well:
Hamilton Lane Stock Price
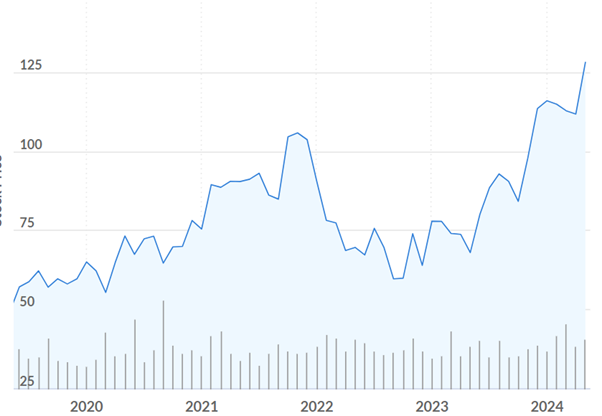
Source: Sentieo
But this is not one for value investors, so shareholders will be hoping that their bullishness on the sector is justified:
Hamilton Lane Valuation ($128)
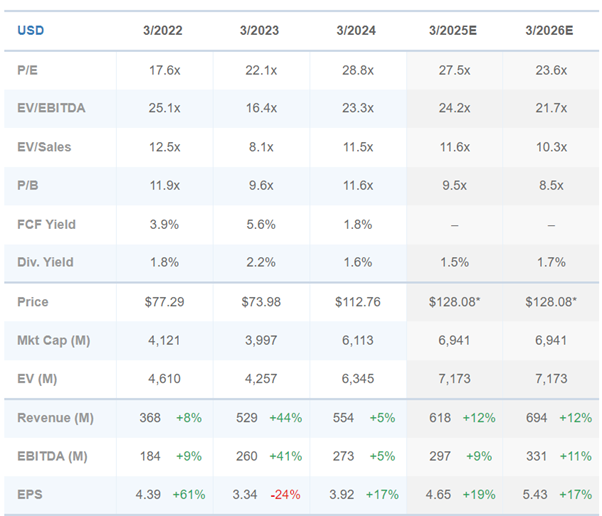
Source: Sentieo
Hamilton Lane’s Report
Performance
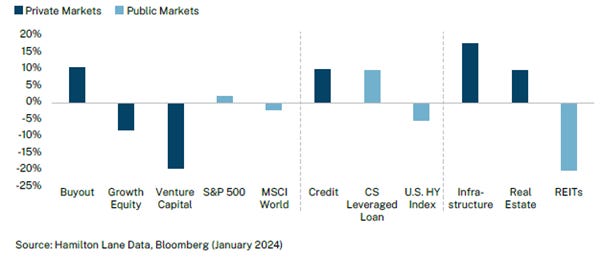
They highlight that private equity has beaten quoted markets from their peak:
Private & Public Market Returns Q4 2021 - Q3 2023
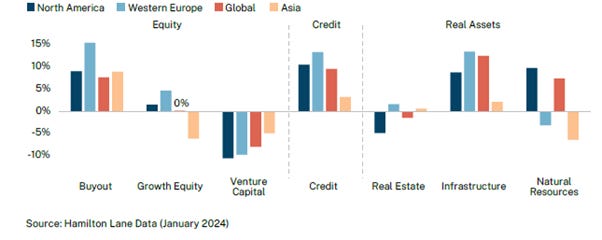
And that buyout has been the best performing class of private markets across most geographies:
Pooled One-Year IRR by Asset Class and Geography Trailing 10 Vintage Years
And this is also true looking over the last 5 years:
Growth of $1 over 5 Years by Class
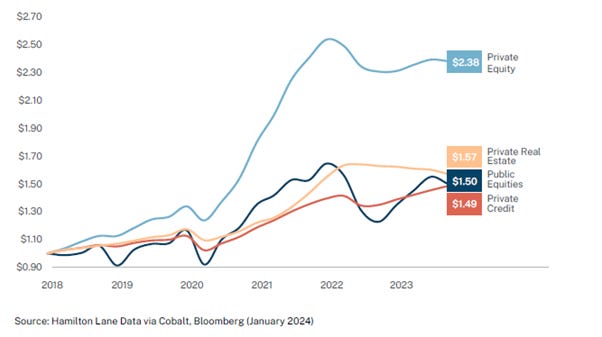
And private markets have also performed well, looking at a longer term projection:
15-Year Asset Class Performance - Annualized Time-Weighted Return as of Q3 2023
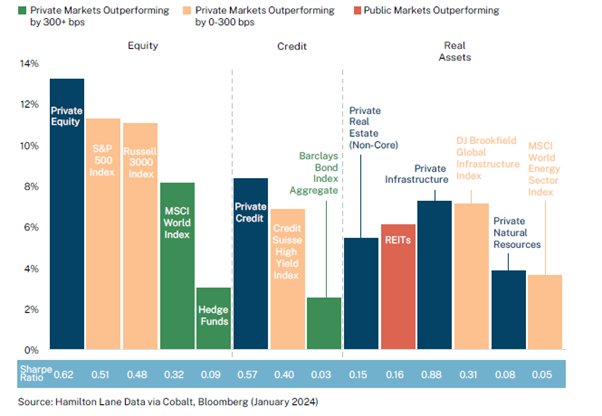
Even against the U.S. indices, which were best global performers in the last 15 years, private equity outperformed. There’s only one area where private markets lagged - REITs outperformed private real estate.
Hamilton Lane highlight that there are few 10-year periods in the last two decades where private equity didn’t outperform.
Private Equity 10-Year Rolling Time-Weighted Returns
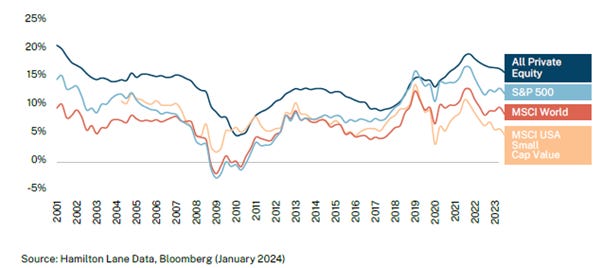
Now, of course we are not comparing like with like, as we are comparing a geared return with an unleveraged one. I wonder if an investor in public markets who used leverage would have done even better than private equity? Note that the returns from private markets in these charts are presumably post fees, so the underlying performance must have been even stronger, although performance may be boosted by internal valuations.
Another quote which I rather enjoyed:
My God, it is good to be a general partner. It is truly a tails I win, heads you lose proposition
I thought this chart was rather interesting as it highlighted how careful you have to be in both public and private markets about valuation – those smart private equity players lost money on half their deals in the dot.com peak year! Now I imagine that a higher percentage of public market players underperformed the index in those years than today, but they likely more than made up for it in the following years.
Loss Ratio of Realized Buyout Deals (% of Deal Count)
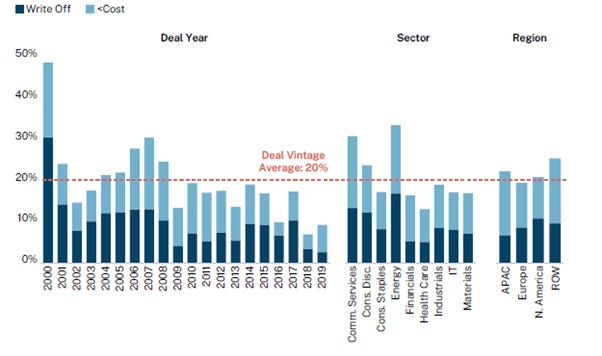
Source: Hamilton Lane (Data as of January 2024)
Hamilton Lane believes that valuations are realistic and there is no future downturn based on inflated valuations today.
Median Operational Performance
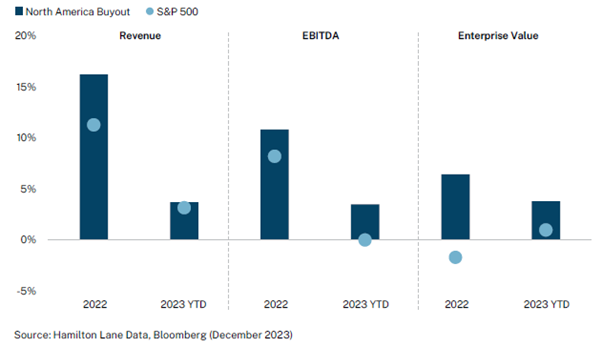
The outperformance in 2022 extending into 2023 simply reflects stronger revenue and EBITDA than public companies, in the authors’ opinion. They also believe that buyout has mainly avoided some more volatile areas that were weak performers – these have a greater weighting in public markets, notably materials and consumer.
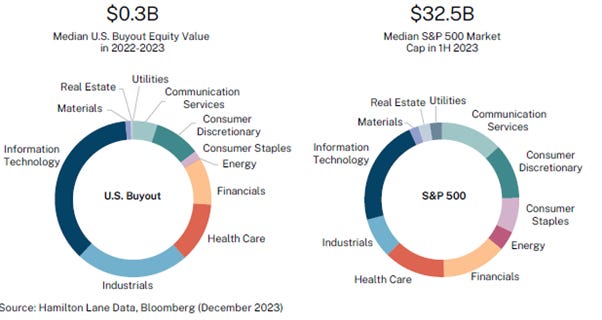
In contrast, buyout has largely been overweight in growthier and more resilient sectors like information technology and industrials. But more important is the size differential: the average company in the S&P 500 is sized at $32.5 billion versus $328 million in the buyout universe. The latter enjoys the benefit of greater domestic exposure, faster reaction times and greater control in a smaller company.
North America Buyout and S&P 500 Company Composition By Sector and Size
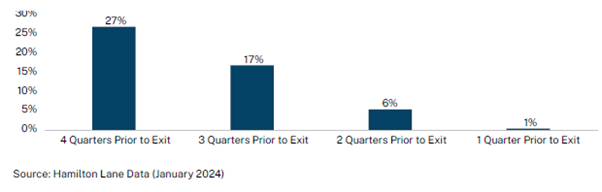
They argue that valuations are realistic as losses aren’t being achieved on sale – although most funds would naturally prefer to sell at a profit and retain the business they cannot sell at an uplift against their internal valuations:
Median Exit Markups During the Year Prior to Exit (Deals Exited Q2 21 – Q2 23)
Valuation Multiples and Interest Rates
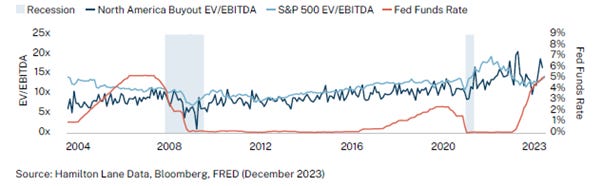
This chart shows that multiples have increased significantly lately and beyond public market valuations, while leverage has been falling as debt becomes dearer and harder to come by:
Buyout Median Leverage Multiple at Acquisition Deal Years 2006 - 22
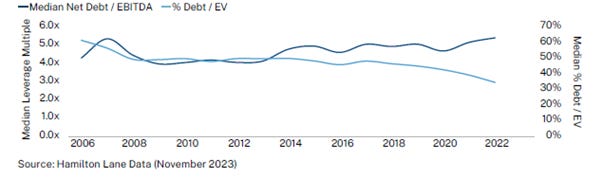
In my view, this combination will almost certainly be a significant negative for future returns.
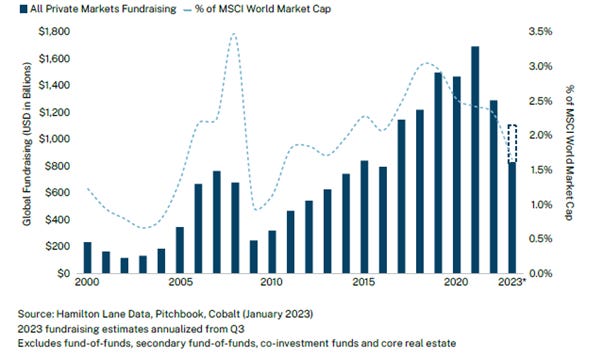
Fundraising
They acknowledge that fundraising is weak, as I illustrated in my recent article.
Global Private Markets Fundraising
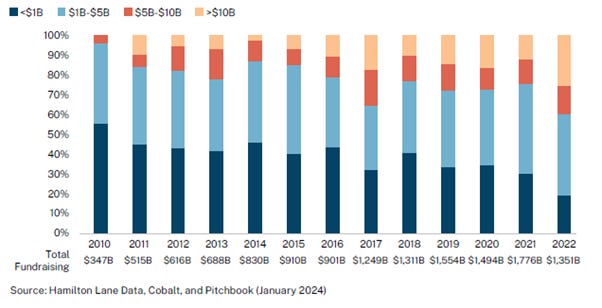
And as we saw before, larger funds are doing better:
Share of Fundraising by Fund Size
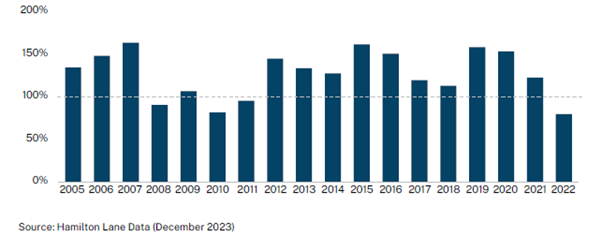
But even the bigger players are finding it more difficult to raise capital.
Buyout Fund Size as Percentage of Target Fund Size
Fundraising cycles are lengthening.
Average Fundraising Length of Top 30 Buyout GPs
Source: Hamilton Lane (Data as of December 2023)
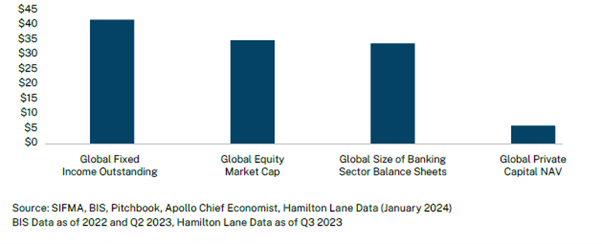
I thought the next chart was interesting. It illustrates that equity markets have grown in value if not in number of constituents and that private equity growth is small relative in absolute terms (although it will surely be larger in percentage terms).
Growth in Public and Private Markets Since 2013 ($tn)
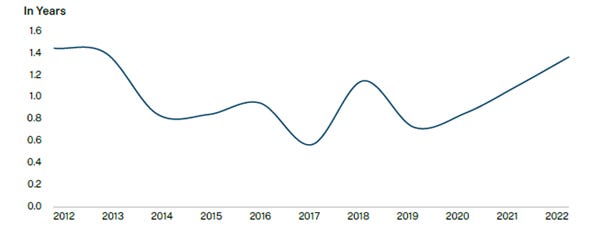
Longer holding periods will lead to reduced IRRs, all else being equal.
Holding Periods
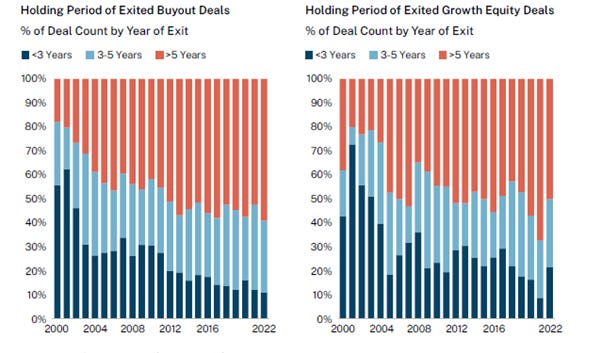
Source: Hamilton Lane (Data as January 2024)
Which means that distributions are down:
Annual Private Equity and Credit Distributions
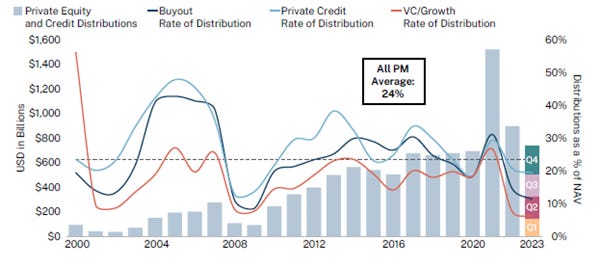
Source: Hamilton Lane (Data as January 2024)
This continues to be a problem with the latest data for Q1 2024 indicating a further decline:
Private Capital Quarterly Deal Value, by Asset Class
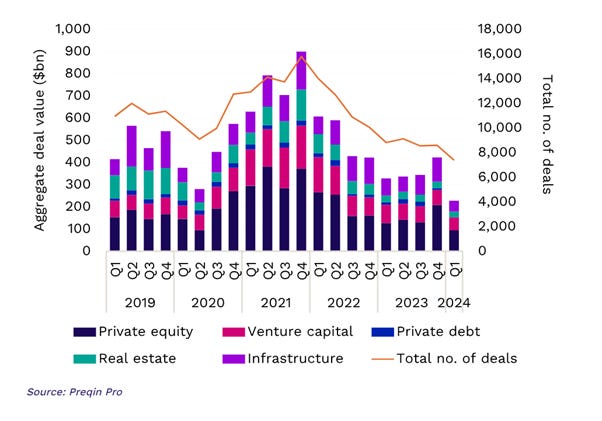
Deals in Q1 were down by 14% in number and value halved, with a $195bn decline vs Q4 2023. This compares with an 8% decline in quarterly deal volume in public markets (S&P CapIQ). Yet Hamilton Lane believe that NAV loans are less prevalent than people think – probably at 15% of managers.
With limited exits, the environment for private equity will only get tougher, with a recent article in the FT highlighting that allocators were constrained in hedge fund investing because of the decline in private equity distributions. This was confirmed to me a few weeks ago. An allocator told my friend that they wanted to invest in his fund but they didn’t have any liquidity because of the lack of private equity distributions.
The recent IPO of Viking may have opened the gates for more floats which will relieve the pressure, but otherwise, if it continued for much longer, it could start to be a constraint on the growth of private markets.
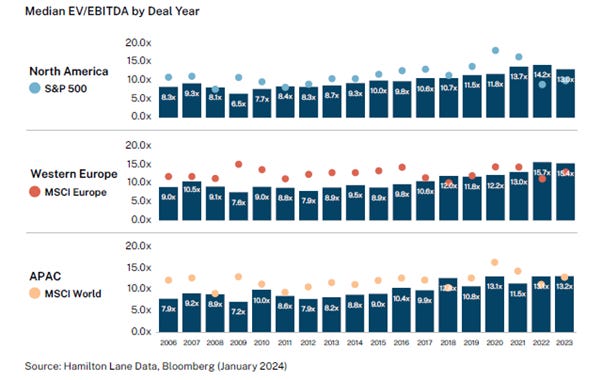
I wasn’t sure about the next chart showing acquisition multiples as it’s counter intuitive that private equity could pay lower prices than public market multiples, and for better businesses.
Purchase Price Multiples at Acquisition
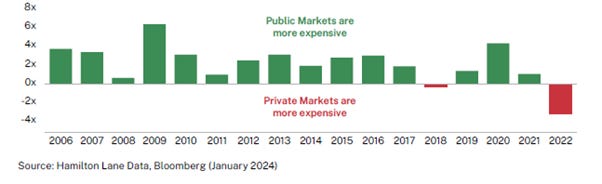
The next chart expresses this view more succinctly. If this were true, it would explain that returns weren’t simply the product of leverage and the benefit of falling rates and rising multiples which has been my perception.
MSCI World Buyout Deal Purchase Price Spread
To be fair, they could be right. But I am not convinced. The chart above, which is for the world, is quite different from the first chart I showed at the start of this post which is from the US. I repeat it below:
Public vs. Private Multiples Pricing (Median U.S. Buyout ACQ EV/EBITDA Minus S&P 500 EV/EBITDA)
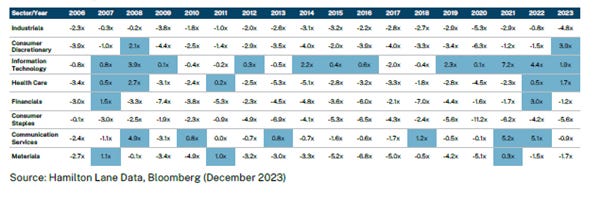
There are quite a few negative numbers on here (indicating a buyout at a discount to the S&P averages), for example in the consumer discretionary and consumer staple lines – but I am guessing that they are buying lower quality brands which are trading more cheaply than Procter & Gamble, or retailers that are underperforming. Realistically, private equity players should be able to transform the fortunes of a struggling retailer and create a lot of value in the process.
I wonder how big that opportunity set is relative to the size of private markets, or how many deals are being done at premia, which require more work and higher exit valuations to maintain the industry’s record of superior returns.
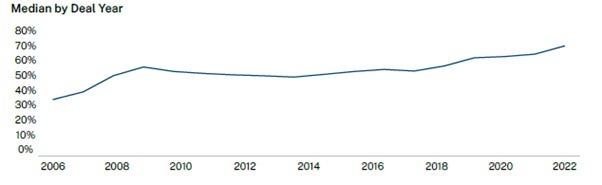
The amount of equity that is being invested into deals is higher than it’s ever been. That doesn’t imply good returns going forward, especially as leverage has been a significant contributor to performance.
Buyout Deals % Equity Contributed
Source: Hamilton Lane (Data as January 2024)
Conclusion
So that’s the bull story – hopefully that gives a more balanced perspective on the sector and will satisfy those private equity players who told me that I was too gloomy. I remain of the view that allocators have over-allocated to private equity; that forward returns won’t match the last decade; and that we shall see more stresses appearing as allocators have to sell public market assets to honour commitments and as private equity do more deals to boost fee income. It will pay to watch this space closely. I would love to chat to more industry participants, particularly if they feel I have missed something. Please get in touch.